Why SVB Was Unique
What Led to The Bank’s Eventual Closure and What Lessons Cash Investors Can Learn From This to Minimize Portfolio Risk
On March 8th, Silicon Valley Bank (SVB) announced a significant balance sheet restructuring and an associated $2.25 billion capital raise to shore up the bank’s financial position after rising rates and significant deposit outflows severely diminished the bank’s funding profile. By Friday March 10th, the bank had closed its doors and was in FDIC receivership following a rapid run on the bank’s deposits by its corporate client base. The collapse of SVB was the largest bank failure in the U.S. since the 2008 global financial crisis. The swift chain of events that eventually led to the bank’s failure was brought on and accelerated by SVB’s unique operating profile, mismatched durations of the bank’s assets and liabilities, and high concentration of uninsured deposits. Due to its unique nature, we do not see a similar dynamic occurring within high grade regional and money center banks.
What Happened to SVB?
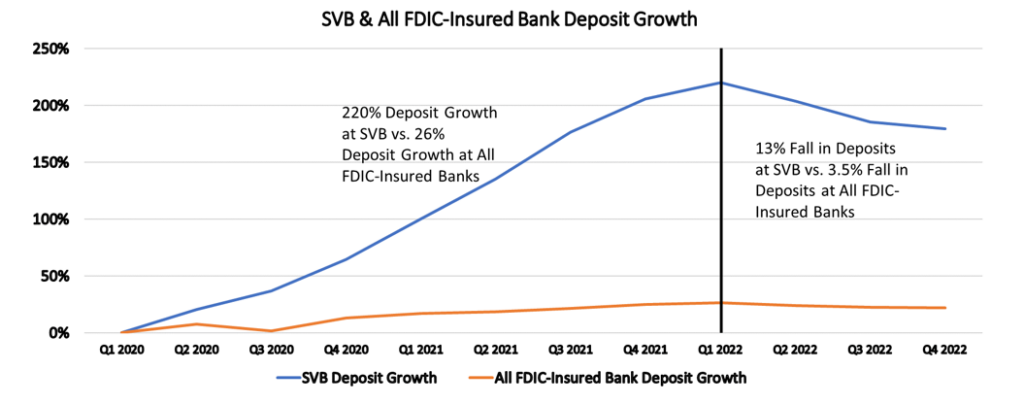
Silicon Valley Bank was “the bank” for venture-backed growth companies. Nearly half of U.S. venture-backed tech and life science companies and 44% of publicly traded venture-backed tech and healthcare companies banked with SVB1. This concentrated client base meant the bank rode the booms and busts of these industries. Following the pandemic, SVB saw an explosion in deposit growth, as low rates led venture-backed companies to raise large sums of money. From Q1 2020 to Q1 2022, SVB’s deposits grew 220%2, compared to 26%3 deposit growth at all FDIC-insured institutions during that time frame. During this time of extensive deposit growth, Silicon Valley Bank invested heavily in its hold-to-maturity (HTM) portfolio, which grew from $14 billion at the end of 2019 to $91 billion at the end of 2022. During the same time frame4, the bank’s available-for-sale (AFS) portfolio grew from $9.6 billion to just $26 billion.
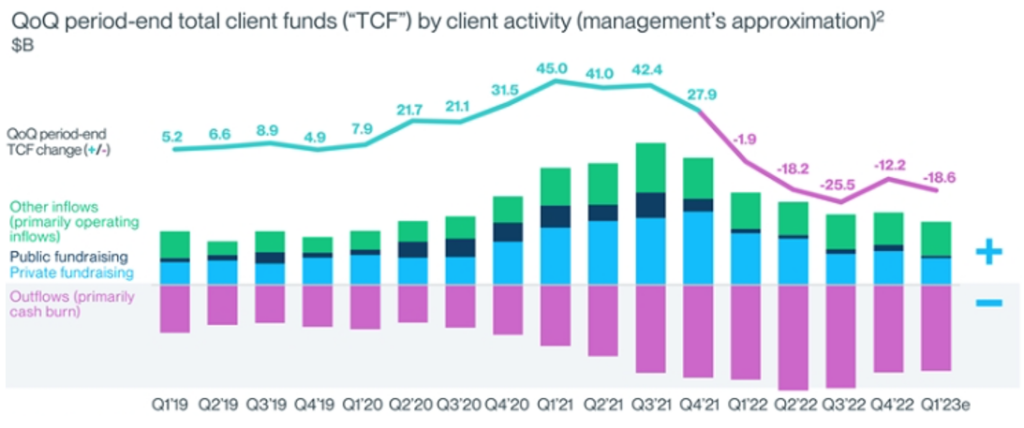
The venture-backed boom began to shift in 2022 as rising interest rates and tightening financial conditions shut down funding markets for venture-backed companies. U.S. Venture-backed funding activity peaked in Q4 2021 with $94 billion of investment activity, and subsequently declined 62% to just $36 billion dollars of activity in Q4 2022. SVB estimated investment activity was on track to decline a further 15%-20% sequentially during Q1 20235.
Despite funding sources drying up, SVB’s clients continued to spend, leading to significant deposit outflows. In Q1 2023, SVB estimated cash-burn rates would be ~ 2X higher for their clients than pre-20216. The bank tried to stem outflows by offering high deposit rates peaking at 1.17% in Q4 2022 vs a median of 0.65% for SVB’s peer group7. However, the bank faced a rapid fall in deposit levels, decreasing 13%8 from Q1 2022 to the end of the year. This is in contrast to a 3.5%9 decrease at all FDIC-insured banks during this time frame. SVB’s significant investments in its HTM portfolio and duration of its AFS portfolio poorly positioned the bank for unexpectedly high client cash burn rates. SVB stated in their March 8th Mid-Quarter Update, “We had expected modest, progressive declines in client cash burn, but burn has not moderated QTD, pressuring the balance of fund flows.”
As deposits drained from accounts, SVB turned to wholesale funding markets, increasing their short-term borrowing from $71 million dollars at the end of 2021 to $13.5 billion at the end of 202210. The higher reliance on wholesale funding and peer-group high cost of deposits pressured profitability metrics as the bank’s net interest margin (NIM) fell to 2.0%11. Additionally, SVB had just over 56% of their assets in investment securities, and only 6.5% in cash and cash equivalents12. These forces eroded the bank’s liquidity profile and eventually SVB had to sell $21 billion of their $26 billion AFS security portfolio. Rising interest rates had pushed the value of these securities down causing SVB to realize a $1.8B after-tax loss in the process13. The goal was to reinvest the sales proceeds into short-term fixed rate Treasuries to take advantage of higher short-end rates and improve liquidity. Additionally, the bank announced they would publicly offer $1.25 billion of common stock, sell $500 million of common stock to private equity firm General Atlantic, and raise $500 million though a mandatory convertible preferred stock offering, for a total raise of $2.25 billion14.
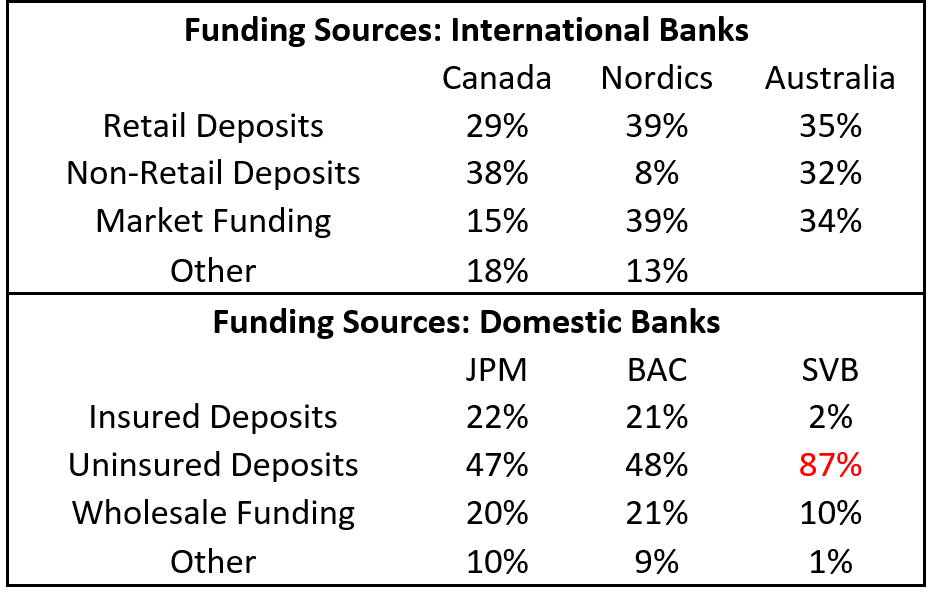
Upon the announcement of the balance sheet restructuring, depositors worried the bank would not be able to meet redemptions and rapidly moved to pull their deposits. The pace and urgency at which deposits were pulled can be explained by their composition. At the end of 2022, SVB held $152 billion of uninsured deposits, accounting for 87.5% of all deposits at the bank. Additionally, ~ 93% of deposits were in non-transaction accounts which tend to be significantly more confidence sensitive due to the lower amount of liquidity of deposited funds15. Additionally, SVB’s operating profile meant it was overexposed to already confidence sensitive commercial deposits with 60% of total bank deposits being from technology or life science/ healthcare companies alone16. These factors led to exceptionally high confidence sensitivity in the bank’s deposit base, which accelerated the withdrawals.
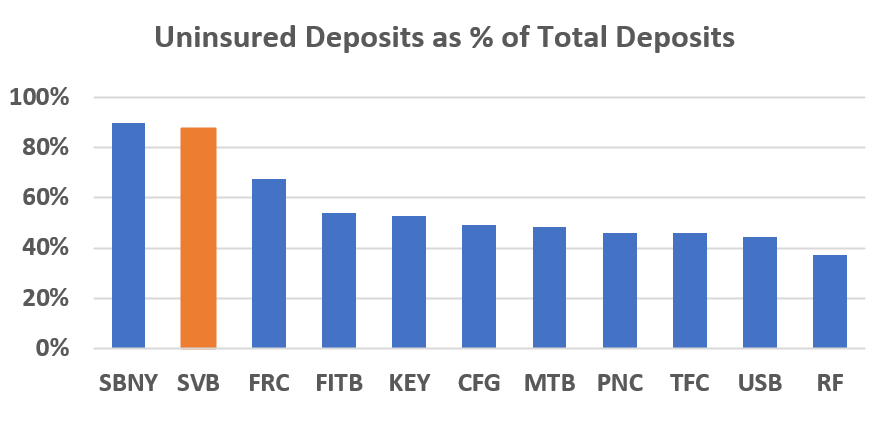
As liquidity worsened, SVB still had its $91 billion HTM security portfolio. However, rising rates had caused the fair value of these securities to fall by ~ $15billion17 and selling a security from this portfolio would cause the rest of the portfolio to revalue, forcing the bank to realize the entirety of the loss.
By Friday, the California Department of Financial Protection and Innovation closed Silicon Valley Bank and appointed the FDIC as receiver. SVB’s fall was extremely rapid and brought on by specific circumstances related to the bank. Namely, its concentrated client base of venture-backed companies which struggled to find additional funding as financial conditions tightened. Then, SVB’s decision to invest the excess deposits in largely HTM securities, which it received during the post-pandemic funding boom, led to an asset liability mismatch as deposit outflows increased more than expected. Once SVB announced its balance sheet restructuring, depositors became worried the bank would be unable to meet redemptions and proceeded to pull their funds. The urgency of which was heightened by the unusually high levels of uninsured deposits in non-transaction corporate accounts.
What Can Be Learned?
What happened to Silicon Valley Bank is a somber reminder of how rapid liquidity risk can lead to a bank’s downfall. SVB’s investment grade credit ratings did not adequately warn investors and depositors of what lay in store. This is largely due to the rapid nature of liquidity crunches which can force highly rated banks into insolvency before investors can adequately assess the situation.
These types of risks highlight the need for cash investors to utilize extensive credit research, and to not get carried away with chasing yield. Despite its high credit ratings, the bank’s concentrated client base and reliance on fickle venture-funding markets for deposits made SVB, and banks with similar operating profiles, inappropriate for corporate cash portfolios. Cash investors should be focused on much larger or systemically important banks that have strict capital and liquidity requirements. These banks also typically have far more diversified deposit bases and loan books across geographies, sectors and business lines making their profiles far more robust. While it is nearly impossible to predict a liquidity crisis, investors can help minimize their risk by sticking to these large, well-diversified and highly regulated institutions.
This event stresses the risks associated with uninsured, concentrated deposits. It becomes easy to forget that large uninsured deposit accounts at banks are large single bank exposures in cash portfolios and thus need to the treated with the respect an analysis associated with any investment in a financial institution. Using a well-managed SMA to invest uninsured deposits in high quality corporate, financial and government debt and a laddered maturity structure coupled with government money market funds ensure treasurers liquidity needs are met without large single bank exposures associated with a solo deposit account at an operating bank. While these basic risk management strategies should be the cornerstone of any portfolio, they can be easily forgotten or overlooked leaving cash investors to be unnecessarily exposed.
1“Strategic Actions/Q1’23 Mid-Quarter Update”, Silicon Valley Bank, March 8th, 2023. https://www.sec.gov/Archives/edgar/data/719739/000119312523064680/d430920dex992.htm
2Company Filings as of 1/31/22
3FDIC Quarterly Banking Profiles as of 1/31/22
4Company Filings as of 1/31/22
5“Strategic Actions/Q1’23 Mid-Quarter Update”, Silicon Valley Bank, March 8th, 2023. https://www.sec.gov/Archives/edgar/data/719739/000119312523064680/d430920dex992.htm
6IBID
7“Moody’s downgrades SVB Financial (senior unsecured to Baa1 from A3); outlook negative”, Moody’s Investor Service, March 8th, 2023. https://www.moodys.com/research/Moodys-downgrades-SVB-Financial-senior-unsecured-to-Baa1-from-A3–PR_474590
8Company Filings as of 12/31/22
9FDIC Quarterly Banking Profiles as of 12/31/22
10Company Filings as of 12/31/22
11“Moody’s downgrades SVB Financial (senior unsecured to Baa1 from A3); outlook negative”, Moody’s Investor Service, March 8th, 2023. https://www.moodys.com/research/Moodys-downgrades-SVB-Financial-senior-unsecured-to-Baa1-from-A3–PR_474590
12Company Filings as of 12/31/22
13“Strategic Actions/Q1’23 Mid-Quarter Update”, Silicon Valley Bank, March 8th, 2023. https://www.sec.gov/Archives/edgar/data/719739/000119312523064680/d430920dex992.htm
14“IBID”
15Company Filings as of 12/31/22
16“Strategic Actions/Q1’23 Mid-Quarter Update”, Silicon Valley Bank, March 8th, 2023. https://www.sec.gov/Archives/edgar/data/719739/000119312523064680/d430920dex992.htm
17Company Filings as of 12/31/22
Please click here for disclosure information: Our research is for personal, non-commercial use only. You may not copy, distribute or modify content contained on this Website without prior written authorization from Capital Advisors Group. By viewing this Website and/or downloading its content, you agree to the Terms of Use & Privacy Policy.


