
The Curve, Trade, and Brexit – Three Themes to Watch in 2019
Abstract
We have identified the Fed and a flattening yield curve, trade wars and a global slowdown, and Brexit and other uncertainties as the three main themes to watch in 2019. Compared to 2018, we think 2019 will be a bit more challenging for short-term liquidity investors. A flatter yield curve may attract more non-traditional buyers and keep the space crowded. Higher interest rates may expose vulnerable credit instruments to higher risks as the economy slows down. Risk diversification and liquidity stratification may help investors weather market liquidity shocks.
Introduction
At the start of each year, we typically name three broad themes that will potentially have great impact on the short-term debt markets. In 2018, businesses and consumers benefited from the 2017 tax cuts. As the Fed continued with rate increases and the Administration escalated trade tariffs with China, the fear of an inverted yield curve predicting recession weighed on the markets towards the end of the year.
Our 2018 outlook picks were a) market implications from the new tax legislation, b) central bank tightening and rising interest rates, and c) many known and unknown risks. 2019 is a challenging year to narrow down the number as multiple trends and events vie for the top spots. Situations on the ground change almost daily, making projections difficult.
In maintaining our tradition of looking at the forest rather than the trees, we narrowed our 2019 candidates to a) the Fed and a flattening yield curve, b) trade wars and global slowdowns, and c) Brexit and other uncertain events.
1. The Fed and A Flattening Yield Curve
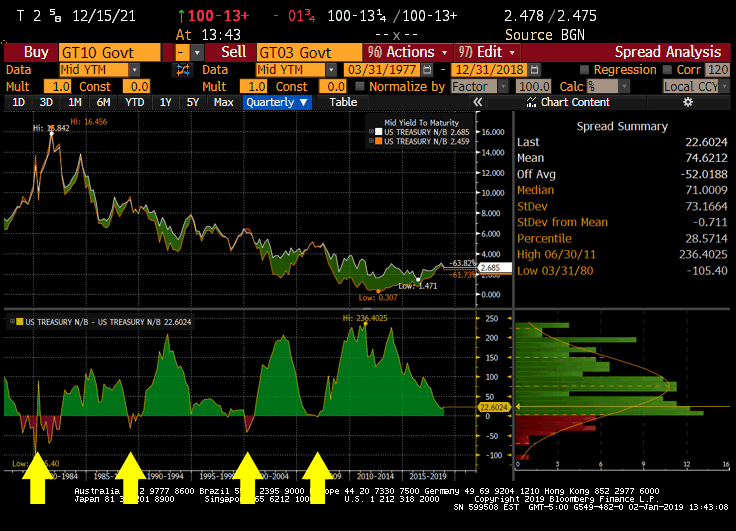
The Fed followed a steady path: The Federal Reserve followed through on its consensus projections and hiked the short-term rates four times in 2018. Relative to the 100 bps increase in the fed funds rate, the 2-year Treasury note rose 63 bps over the 1-year period. Long-term yields, represented by the 10-year note, rose merely 28 bps. The faster rise in short-term over long-term interest rates is a phenomenon known as flattening of the yield curve. The yield spread between the 2- and 10-year notes was as tight as 0.11% on December 4th and ended the year at 0.23%.
The curve may flatten further: Heading into 2019, we may witness further flattening of the yield curve if the Fed continues with rate hikes as indicated at its December meeting while yields on long-term debt hold steady or decrease. Financial markets are currently concerned that an inverted yield curve, when long-term debt yields less than short-term debt, will usher in a period of slow growth or an outright recession.
A partial inversion: For a few days in early December, the market was startled by a “partial inversion,” namely an inverted relationship between 2- and 7-year parts of the curve; a “full inversion” refers to the relationship between the 2- and 10-year notes. In the last four decades, each time this has happened, the U.S. economy entered a recession soon afterwards. This makes an inverted curve the most reliable indicator of an impending recession, which explains the market’s obsession with it.
Figure 1: History of 2- and 10-Year Treasury Yield Spread

Source: Bloomberg.
Predictive power of an inverted curve on recession: As Figure 1 indicates, the US yield curve has been inverted four times in the last four decades, each of which preceded a recession: 1980-1982, 1990-1991, 2001 and 2007-2009.
Late stage in economic cycle: The longest economic expansion in this country was 120 months (1991-2001) according to National Bureau of Economic Research. Our current expansion cycle will match that record by June 2019 and likely break it. Should the economy slip into recession in late 2019 or 2020, the current cycle will still have been the longest in recorded history.
Timing uncertain: Although an inverted curve generally predicts recession, the length of time varies from a few months to a year or longer. During this period, market returns may be positive or negative. Looking at past cycles, from the date the curve inverts, the subsequent 12-month equity returns were between -21% to 37%1. In other words, timing the market based on an inverted curve may yield uncertain results.
A more cautious and data dependent Fed: As the Fed indicated after its December policy meeting, the path to higher rates will likely become “more gradual” and with a “high degree of uncertainty”. Eleven of 17 officials expect the Fed will need to raise rates no more than two times this year, compared to 7 out of 16 in September. As of this writing, the market does not anticipate any rate increases in 2019.
Timing the market could be perilous: The takeaway from the flat, and possibly inverted, yield curve is that it provides a signal of slower growth and a halt to the Fed’s tightening bias. It is, however, inaccurate in pinpointing a recession or the next rate cut.
2. Trade Wars and A Global Slowdown
Trade conflict is seen as the top threat to the economy: President Trump’s insistence on bilateral trade talks and aggressive tactics to force trade partners to the negotiation table have contributed to growth concerns at home and abroad. A survey of economists by the Wall Street Journal last December found that trade conflict with China would be the biggest threat to the US economy in 20192. About 47% of surveyed economists picked it over financial market disruptions, which came in second at 20%. In a separate survey conducted by the Wall Street Journal, about half of chief financial officers (CFOs) at US firms believe a recession is likely by the end of 2019 mainly due to tighter labor and trade tensions3.
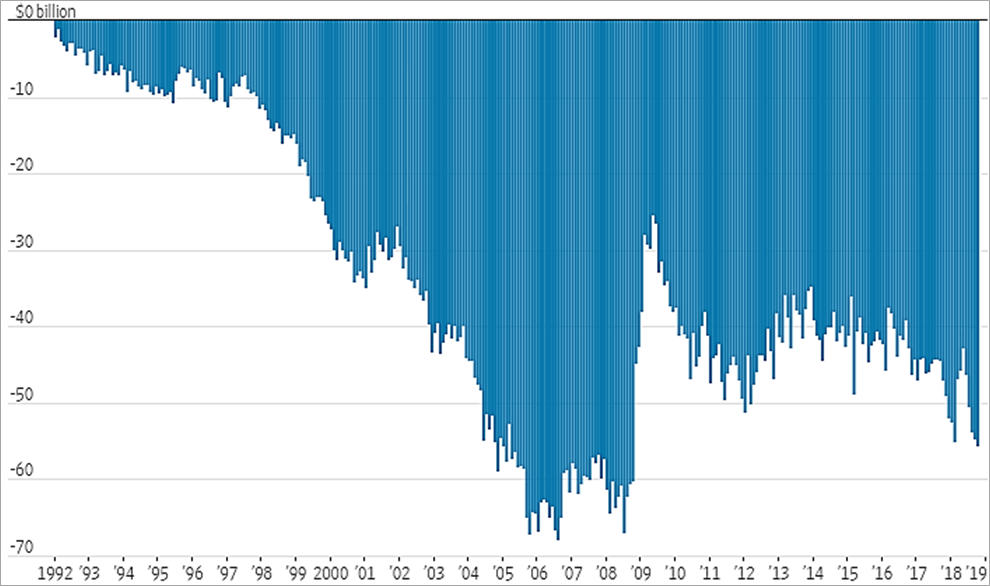
Widest trade deficit in a decade: Negative effects from trade tariffs began to surface in recent months. For example, American companies are paying twice as much in tariffs in October as in May of 2018. It was the first full month when tariffs on $250 billion of imports from China were in effect. It also happened to be the month in which the trade deficit reached the highest level in 10 years, driven by increased demand from the 2017 tax change and falls in tariff-related exports. According to the Commerce Department, the negative gap in goods and services climbed 1.7% from the prior month to a seasonally adjusted $55.5 billion4’5. The gap may worsen if the dollar strengthens further, making US goods and services more expensive to foreign buyers.
Figure 2: US Trade Balance in Goods and Services (Monthly; Seasonally Adjusted)

Source: Commerce Department via WSJ (Note 5)
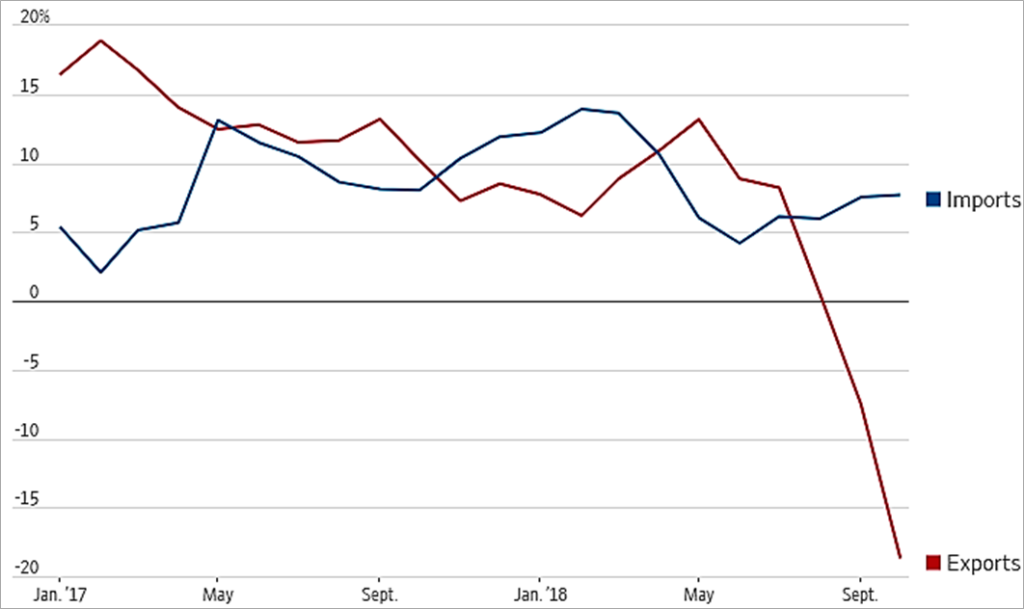
With respect to trade with China, imports in October held steady while US exports collapsed. The sharp drop is partially explained by China’s retaliatory move against US actions and reduced demand from its slowing domestic economy.
Figure 3: US Trade with China, 1-year Change (Based on 3-Month Moving Average for Imports & Exports)

Source: Commerce Department via WSJ (Note 5)
A trade ceasefire is in effect: The US and China have a 90-day window through March 1st, 2019 to reach a long-term agreement. Failure to do so will result in the US imposing 25% tariffs on the $200 billion Chinese imports currently taxed at 10%; China may respond in kind through non-quantitative means. Suffice to say that the higher tariff rate will have more meaningful impact on US corporate profits, consumer spending, unemployment, inflation and credit costs, all of which may contribute to further slowdowns in economic activity. The cumulative effect could be nonlinear, meaning the effects could become increasingly more onerous as the conflict drags on. Since supply chains in the rest of East and Southeast Asia are intertwined with China, the spillover effect on other US trade partners such as South Korea, Australia and Malaysia is difficult to estimate. The arrest of a senior executive at Huawei, a prominent Chinese Tech firm, in Canada as requested by a US court may complicate efforts in reaching a broad deal.
The fate of USMCA is in the hands of a new Congress: While trade conflicts with China are in the spotlight, the Trump Administration has yet to agree on permanent trade terms with most other trading partners. The new Democratic majority in the House of Representatives put the outcome of the just-signed US Mexico and Canada Agreement (USMCA) in jeopardy. Should the new agreement fail to pass, the non-renewal of the current NAFTA accord could result in higher import taxes on autos and other consumer goods.
EU and Japan wait in the wind: On July 25, 2018, President Trump and European Commission President Jean-Claude Juncker had a handshake agreement to work towards zero tariffs, zero non-tariff barriers, and zero subsidies on non-auto industrial goods6. Since then, no meaningful progress has been announced. On October 18th, after a meeting between US Secretary of Commissioner Wilbur Ross and the EU Trade Commissioner, US Ambassador to the EU Gordon Sondland told reporters that the Europeans “are giving the impression that things are moving forward. They are not moving forward, not moving at all7.” US representatives revived the possibility of fresh tariffs on European cars if progress is not made.
Likewise, President Trump criticized Japan over trade, stating that Tokyo treats the US unfairly on auto imports. He and Japanese Prime Minister Shinzo Abe agreed to start trade talks back in September, but no update emerged since8.
The pace of growth will slow globally: The trade disputes come at a time when signs have pointed to slowdowns in major economies. In the US, the “sugar high” from the 2017 tax reform has started to wane. The housing sector is slowing from higher interest rates. Demand for autos is softening. Tight labor presents a drag on productivity. In addition to shrinking exports, the purchasing manager and industrial production statistics suggest slowdown across the regions.
The World Bank’s June 2018 report projects advanced economies will grow at 2.5% in 2019 compared to 2.7% in 20189. Growth in the US will likely slow down to 2.5% from 2.7% this year. The eurozone is expected to decelerate to 1.7% from 2.1% and Japan to 0.8% from 1%. And, it is anticipated that China will slow to 6.3% from 6.5%. Note that these projections were made before the escalation of trade conflicts and market worries over recession.
The announcement by the European Central Bank to end its quantitative easing program is another reminder that central banks likely will no longer be as accommodative as they were in the last decade.
3. Brexit and Other Uncertainties
The decision by British Prime Minister Theresa May to postpone a parliamentary vote on the final Brexit deal until January 14th sent a shockwave through the business and financial world. Although she subsequently survived a no-confidence vote among members of her own Conservative Party, she received no new commitment from the EU, especially regarding the exit date from the “Irish backstop”. Her hold on power reduced the possibility of a second referendum for the UK to remain in the EU. Since she is no closer in getting the votes to pass Parliament, the risk of a no-deal Brexit increased significantly.
As the March 29th deadline draws near, businesses and financial markets became increasingly aware that the previously unthinkable chaotic Brexit scenario may turn out to be the most likely outcome unless things change quickly. The Bank of England said that a no-deal Brexit could trigger a deep and damaging recession worse than the 2008 financial crisis. GDP could fall by 8% in 2019, house prices could be down by 30% the and unemployment rate could increase from 4.1% to 7.5%. In addition, inflation could rise from 2.3% to 6.5%, while interest rates could rise in tandem to combat higher inflation10. An IMF report puts the GDP impact from a no-deal Brexit at 6.2%. If a deal is reached, the shrinkage in the UK’s GDP would be between 2.6% and 3.9%11.
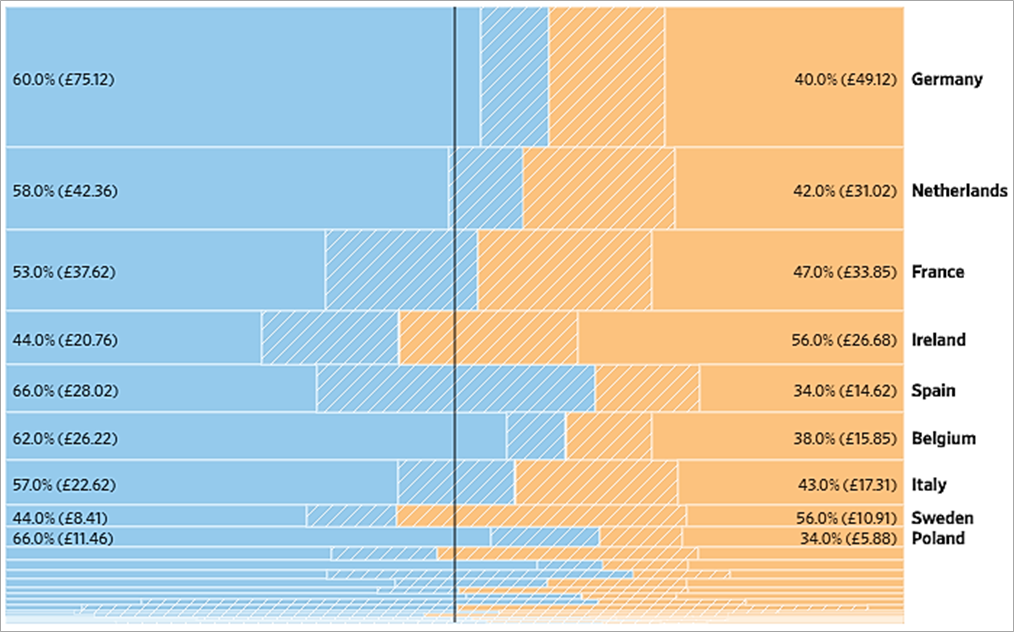
Figure 4: UK Trade Balance with EU Member Countries

Source: HMRC (goods); ONS (services) all data are for 2016, The Wall Street Journal12
Expect major disruptions from a no-deal Brexit: A no-deal Brexit is a big deal not just for the UK, but also to the rest of Europe as Brexit impacts a lot more than just trade13. For example, unresolved matters related to immigration and the legal and financial concerns could impact air travel, electricity supply, financial transactions and border checks. The supply chain is another factor to consider since the country’s supermarket chains hold as little as one-and-a-half days’ worth of fresh food. Medical and automotive firms will similarly be impacted. Nearly three quarters of Britain’s pharmaceuticals are imported from the EU. Automaker Toyota keeps enough parts for just four hours of assembly work at its UK car plant and relies on 50 trucks entering Britain each day to build its cars.
End of Passporting: Especially relevant to investors in the short-duration debt markets is the loss of passporting of financial firms operating out of London who can no longer serve clients in any EU country. While the EU granted a one-year extension for UK-based clearinghouses to clear the £26 trillion derivatives market on a “temporary and conditional” basis, investors could remain unsettled by lingering uncertainties of unforeseen financial consequences of Brexit.
Expect uncertainties elsewhere: This is the decade of geopolitical uncertainties. While we do not know how Brexit will play out in three months, surprises could emerge elsewhere in Europe, the Middle East and Asia. After a period of calm, political risk returns to Europe, where a parliamentary election will be held, and populists are expected to make gains. German Chancellor Angela Merkel’s decision to step down as party leader introduces political uncertainty in the next leadership in Germany and the EU block. There is the on-and-off fiscal conflict between Italy’s ruling coalition and the European Commission. The winding down of the Mueller investigation, the fallout from the killing of journalist Jamal Khashoggi in Saudi Arabia, the surprise withdrawal of US troops from Syria and potential reescalation of nuclear threats from North Korea could all lead to major financial market volatility.
Portfolio Implications – A Year of Inflections
In last year’s market outlook, we were generally sanguine about interest rates and credit spreads. We think 2019 will be a bit more challenging for short-term liquidity investors.
As noted earlier, we think the Fed’s path to higher rates will become less apparent. Fed officials currently have a consensus projection of two hikes in 2019 while the market believes they are done. Growth concerns and flight to quality may pressure long-term yields, resulting in further flattening, or even inversion, of the yield curve. This phenomenon will make short-term debt instruments more attractive for non-traditional buyers and leave the space more crowded. A flatter curve also offers less incentive to extend portfolio duration.
On the credit front, higher interest rates will expose vulnerable credit instruments to higher risks as the economy slows down. Already, market strategists warn of the widening credit spreads between high grade and high yield bonds. We think portfolios will be better served with higher average credit quality while also keeping a keen eye on securities with poor market liquidity.
As managers of institutional liquidity portfolios, we remain mindful of trends and events that may present shocks to market liquidity. Risk diversification and liquidity stratification among several proven instruments may help investors weather some of these shocks.
Our research is for personal, non-commercial use only. You may not copy, distribute or modify content contained on this Website without prior written authorization from Capital Advisors Group. By viewing this Website and/or downloading its content, you agree to the Terms of Use.
1James Mackintosh, Afraid of the yield curve? You’re looking at the wrong one. The Wall Street Journal: Streetwise, December 6, 2018 1:16 p.m. ET, https://www.wsj.com/articles/afraid-of-the-yield-curve-youre-looking-at-the-wrong-one-1544120177
2Harriet Torry, Economists see US-China trade war as biggest threat in 2019, The Wall Street Journal: Economy: US Economy Section, December 13, 2018 10:00 a.m. ET, https://www.wsj.com/articles/economists-see-u-s-china-trade-war-as-biggest-threat-in-2019-11544713201
3Sharon Nunn, Many US financial officers think a recession will hit next year, The Wall Street Journal: Markets, December 12, 2018 6:01 a.m. ET, https://www.wsj.com/articles/many-u-s-financial-officers-think-a-recession-will-hit-next-year-11544612460
4Sharon Nunn, What explains the trade deficit hitting a decade-high? The Wall Street Journal: Economy: Economic Data, December 6, 2018, 1:08 p.m. ET https://www.wsj.com/articles/u-s-trade-deficit-hit-decade-high-in-october-1544103294
5Real Time Economics Newsletter, Are tariffs working? The Wall Street Journal, December 7, 2018 4:59 am ET https://blogs.wsj.com/economics/2018/12/07/real-time-economics-u-s-tariff-revenue-is-at-a-record-highand-so-are-u-s-imports/?mod=djemwhatsnews
6Emre Peker, US, EU trade teams seek fast results and big savings, The Wall Street Journal: Europe, October 21, 2018 8:00 a.m. ET, https://www.wsj.com/articles/u-s-eu-trade-teams-seek-fast-results-and-big-savings-1540123200
7Jorge Valero, US blames Europe for lack of progress in trade talks, threatens car tariffs, Eurativ.com, October 18, 2018, https://www.euractiv.com/section/economy-jobs/news/us-blames-europe-for-lack-of-progress-in-trade-talks-threatens-car-tariffs/
8Tim Kelly and Linda Sieg, Vice President Pence pushes Japan for bilateral free trade agreement, Reuters: Japan, November 12, 2018 7:38 PM, https://www.reuters.com/article/us-usa-trade-japan/vice-president-pence-pushes-japan-for-bilateral-free-trade-agreement-idUSKCN1NI02I
9Global Economic Prospects: The turning of the Tide? A World Bank Group Flagship Report, World Bank Group, June 2018.
10Richard Partington, Bank of England says no-deal Brexit would be worse than 2008 crisis, The Guardian: Business: Economy. November 28, 2018 12:15 EST, https://www.theguardian.com/business/2018/nov/28/bank-of-england-says-no-deal-brexit-would-be-worse-than-2008-crisis
11Chris Giles, IMF warns no-deal Brexit would cause “widespread disruptions”, Financial Times, November 14, 2018, https://www.ft.com/content/20acb9fc-e827-11e8-8a85-04b8afea6ea3
12Stephen Fidler and Laurence Norman, Behind the Brexit chaos, a faulty UK negotiating strategy, The Wall Street Journal: World: Europe: Analysis, December 14, 2018 6:09 a.m. ET, https://www.wsj.com/articles/behind-the-brexit-chaos-a-faulty-u-k-negotiating-strategy-11544783400
13Briefing: Free falling: What to expect from a no-deal Brexit, The Economist, November 24, 2018, https://www.economist.com/briefing/2018/11/24/what-to-expect-from-a-no-deal-brexit
Please click here for disclosure information: Our research is for personal, non-commercial use only. You may not copy, distribute or modify content contained on this Website without prior written authorization from Capital Advisors Group. By viewing this Website and/or downloading its content, you agree to the Terms of Use & Privacy Policy.
