
Shifting Dynamics of a Maturing Expansion
Co-authored by: Spyros Qendro, CFA
Abstract
The past few years have been predictable for investors, with an expanding economy accompanied by steadily rising interest rates and asset prices. In this two-part series, we look at some recent developments and their implications for the current environment. In part one, we look at recent equity market volatility, risks to the credit outlook, and rising trade tensions.
Introduction
As the U.S. economy enters its tenth year of expansion, the outlook remains positive. This recovery, though slow, has been amongst the longest on record and has resulted in the lowest unemployment rate since 1969. Growth looks to have exceeded 3% in 2018 on the back of the recent tax cut and additional fiscal stimulus. Furthermore, it seems possible that additional spending in the way of an infrastructure bill may come to fruition next year. Labor market slack continues to diminish, as the economy routinely adds 200K+ jobs a month and people re-enter the labor force. Even wage growth appears to be finally picking up, crossing the 3% mark for the first time since 2009 in October.
This optimism extends to financial markets as well. Equity markets have risen threefold from the bottom in 2008, as corporate profits have reached new levels. Credit spreads have tightened amidst low default rates. And after a long period at zero, interest rates have returned closer to more normal levels as the economy has improved and the Fed has tightened monetary policy.
But despite all this tranquility, risks for investors are reemerging. In this two-part series, we discuss some of those risks and their potential impact on the broader economy, as well as credit conditions and the outlook for investors. In part one, we focus on recent developments in equity markets, credit markets, and trade.
Equities
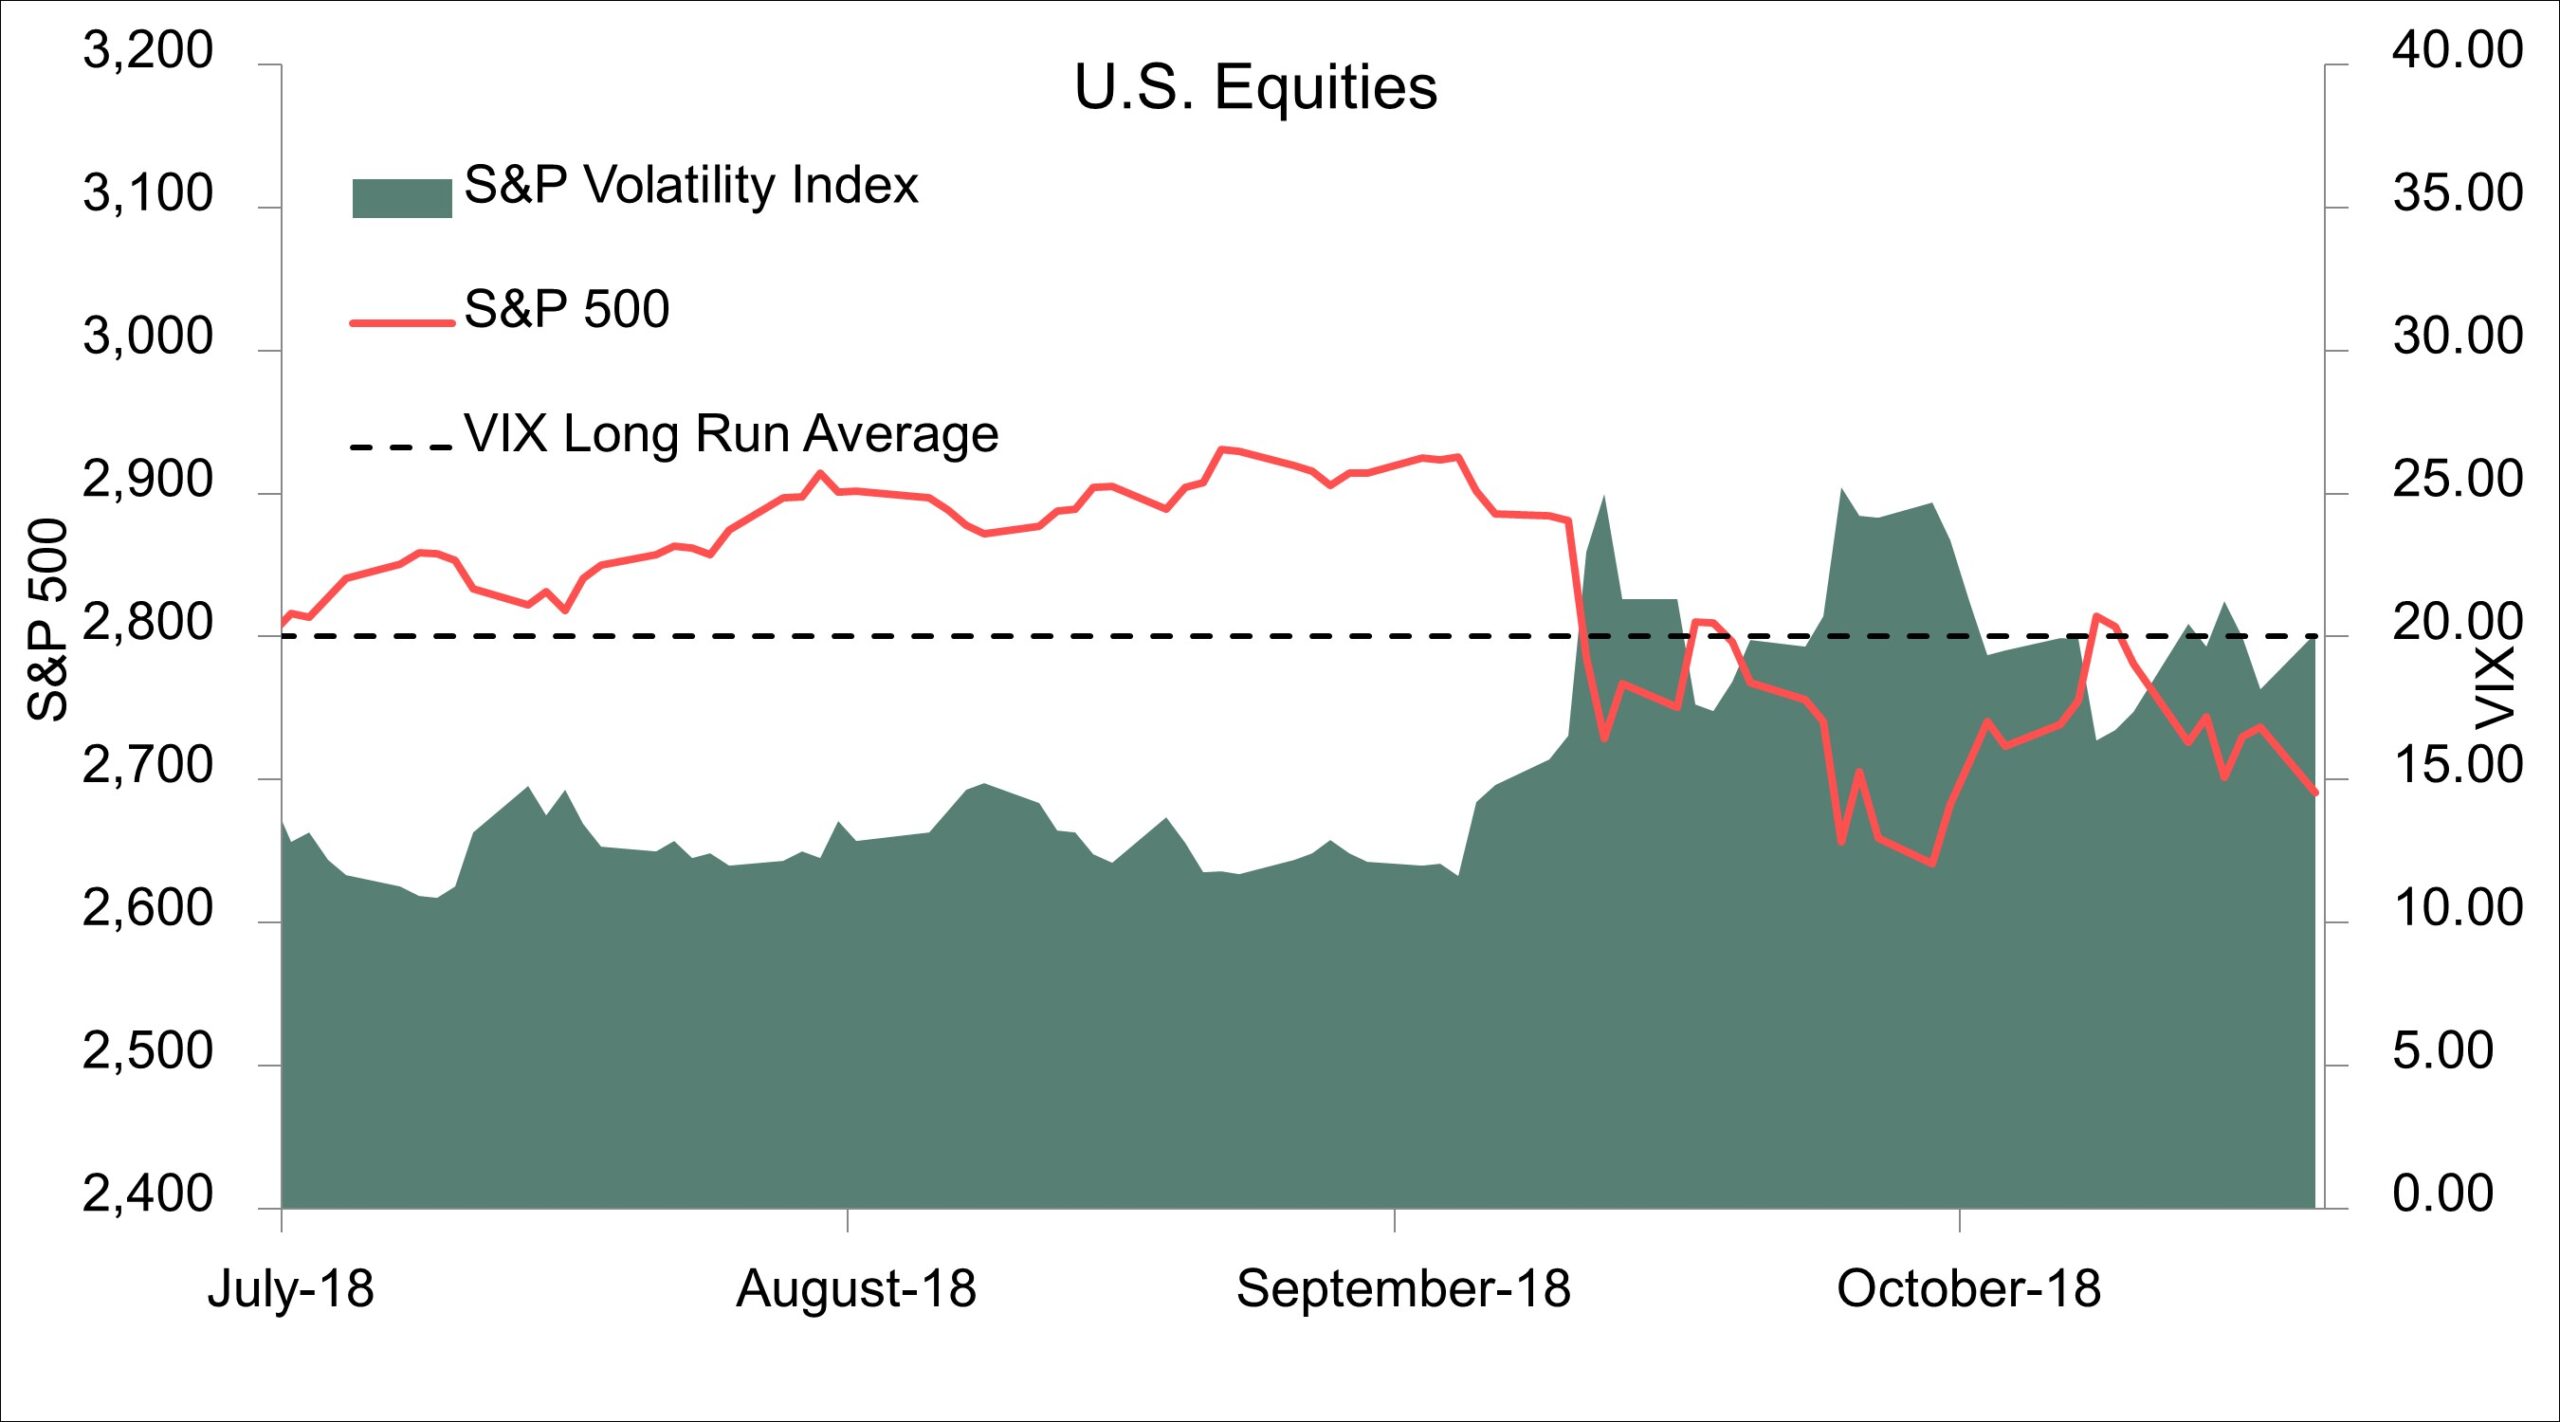
Let’s start with equity markets. Short-term fluctuations in stocks are often driven by investor psychology as well as sheer randomness. But long-term trends, given their forward-looking nature, can hint at shifting dynamics within the economy. In that sense, after a sustained period of peace and tranquility, the past few weeks have been a bit of a wake-up call to investors. As Figure 1 shows, domestic equity markets have sold off from their recent highs, and volatility has picked up (though it is still relatively mundane by historical standards).
Figure 1: U.S. Equities

Source: Bloomberg LP
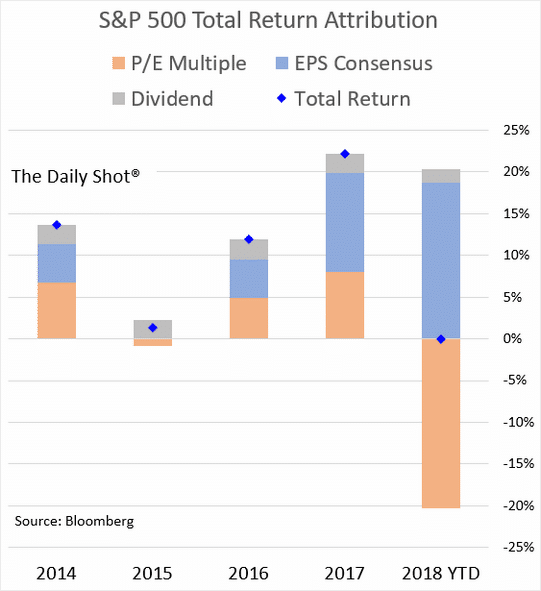
Interestingly, the sell-off comes in the midst of generally positive earnings results from large corporates. Buoyed by robust economic growth and a corporate tax cut, S&P 500 companies saw real earnings growth of 17.8% year-over-year as of the end of the second quarter of 2018. Expectations are that Q3 numbers might have been even better, with FactSet reporting that more than 75% of S&P 500 companies beat their earnings guidance. Nevertheless, the stock market is basically flat on the year because of a significant contraction in firms’ price-to-earnings multiples (Figure 2).
Figure 2: S&P 500 Total Return Attribution
Source: WSJ The Daily Shot, Bloomberg LP
There are different ways to look at this. On the one hand, a contraction in the P/E multiple may signal that the market expects a significant slowdown in economic growth going forward. This is certainly not out of the question; the recent deficit spending binge could act to push up the timeline for the next downturn. However, as New York Times’ Neil Irwin of the Upshot blog points out, perhaps a better way to view this is as a “new phase” in the expansion. After a long period of optimal conditions for corporate profits, we’ve now reached the stage where conditions for stocks are “less optimal.” For instance, interest rates are rising, which negatively impacts stock valuations. And as labor market slack has diminished, wage growth has finally started to rise, hitting a multi-year high of 3.1% year-over-year in October. These developments are likely good for the economy, e.g. rising wages will help bolster consumer demand even as the effect of the tax cut fades. However, they are likely to hinder equity market performance somewhat (even if only compared to the past few years).
Credit
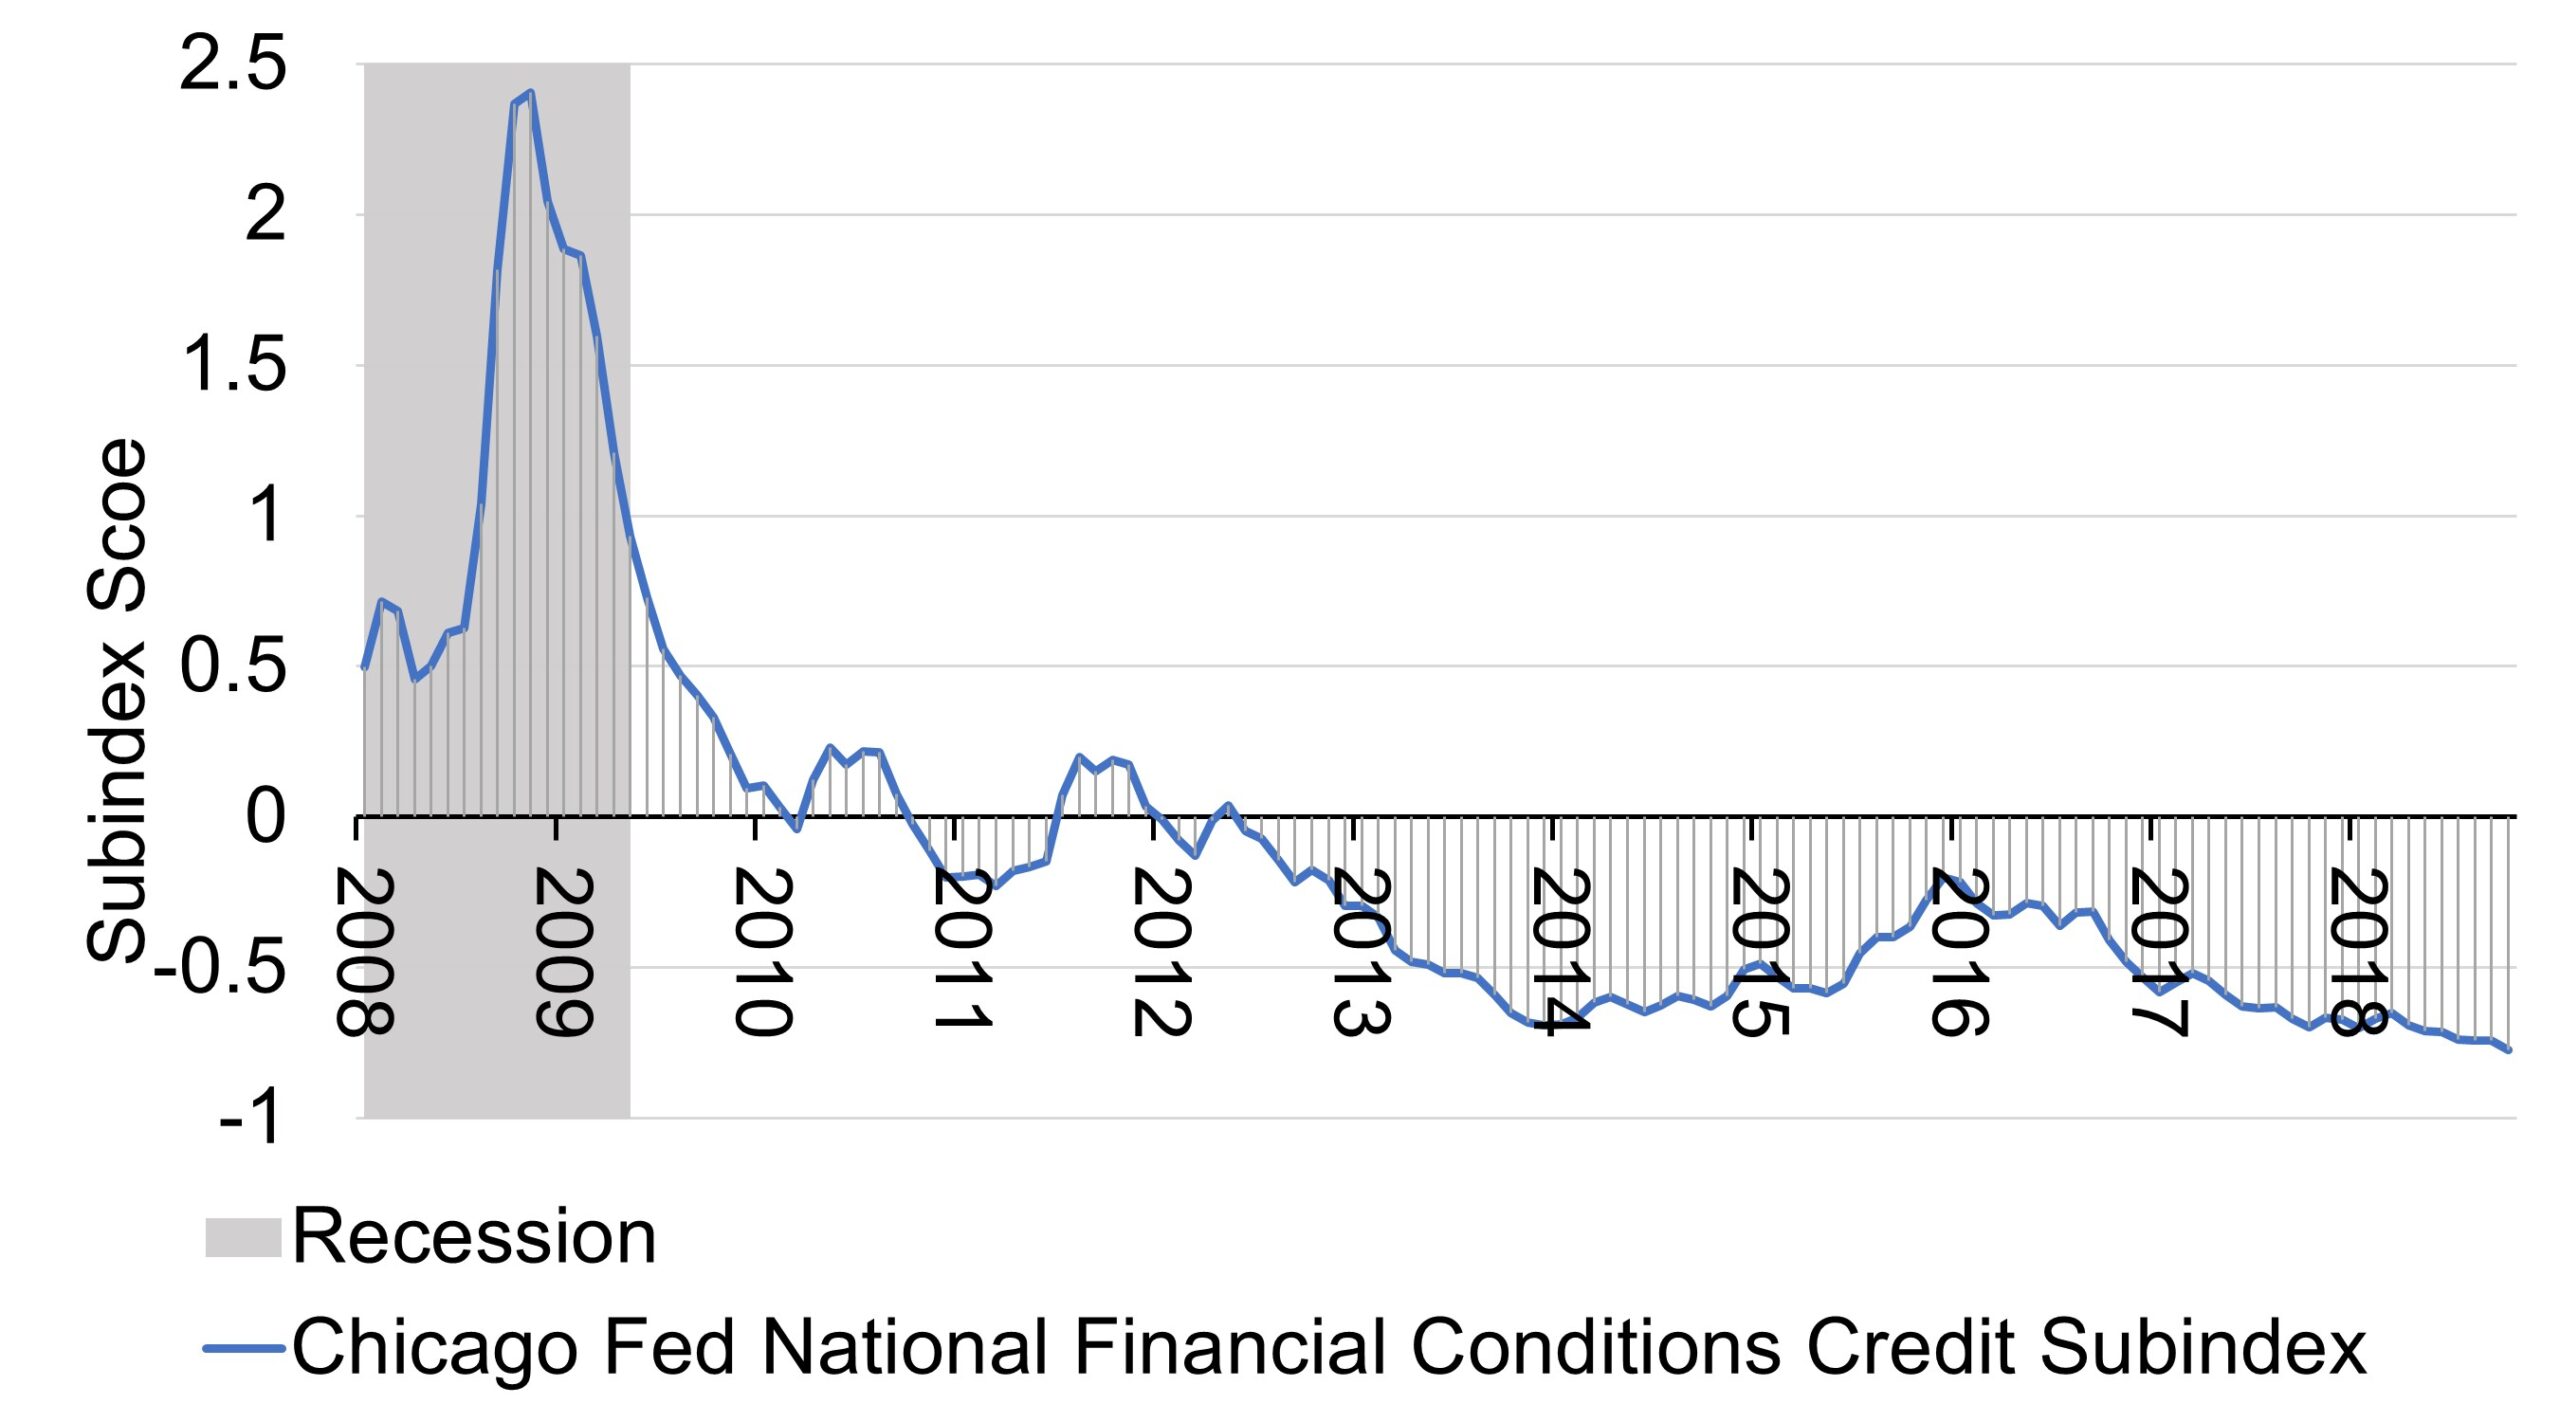
Benign economic conditions, steady earnings growth, and low, though rising, interest rates over the past decade have brought about the second longest expansion in American history. Credit conditions have been looser than average, given the current stage of the business cycle, as indicated by the Chicago Fed National Financial Conditions Credit Subindex (Figure 1), the impact of which can also be seen in the low US corporate defaults numbers over the past few quarters (Figure 2).
Figure 1: Chicago Fed National Financial Conditions Credit Subindex
Source: FRED, Federal Reserve Bank of Chicago
Figure 2: Healthy Economy Continued to Slow Default in Third Quarter

Source: WSJ The Daily Shot, Moody’s Investors Service
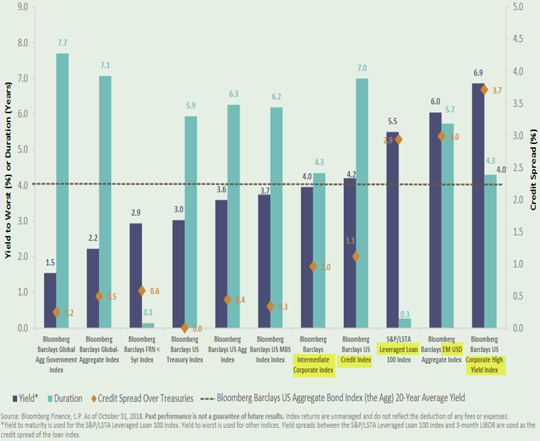
Nevertheless, benign conditions so far have instigated demand for higher-risk assets by holding a lid on yields of traditional bonds. Those currently stand below historical averages (Figure 3).
Figure 3: Bond Market Segment Yield, Duration and Spreads
Source: WSJ The Daily Shot, Bloomberg LP
This move towards riskier credit by investors has helped maintain tighter than average spreads between investment grade and speculative grade debt. Over recent years, outstanding investment grade debt sitting in the lower tiers of investment grade ratings has increased significantly (Figure 4), exemplifying how tighter spreads between rating tiers have reduced the imperative for companies to maintain low leverage and high ratings (Figure 5) in order to secure cheap funding.
Figure 4: The Big Downgrade – More Than Half of the U.S. Investment-Grade Index Now Sits in the Lowest Ratings Tier
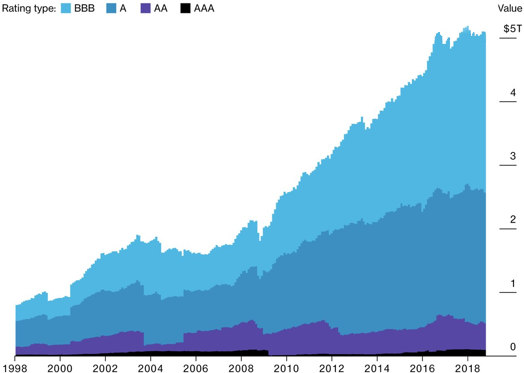
Source: WSJ The Daily Shot, Bloomberg Barclays Indices
Figure 5: FRED Graph Observations
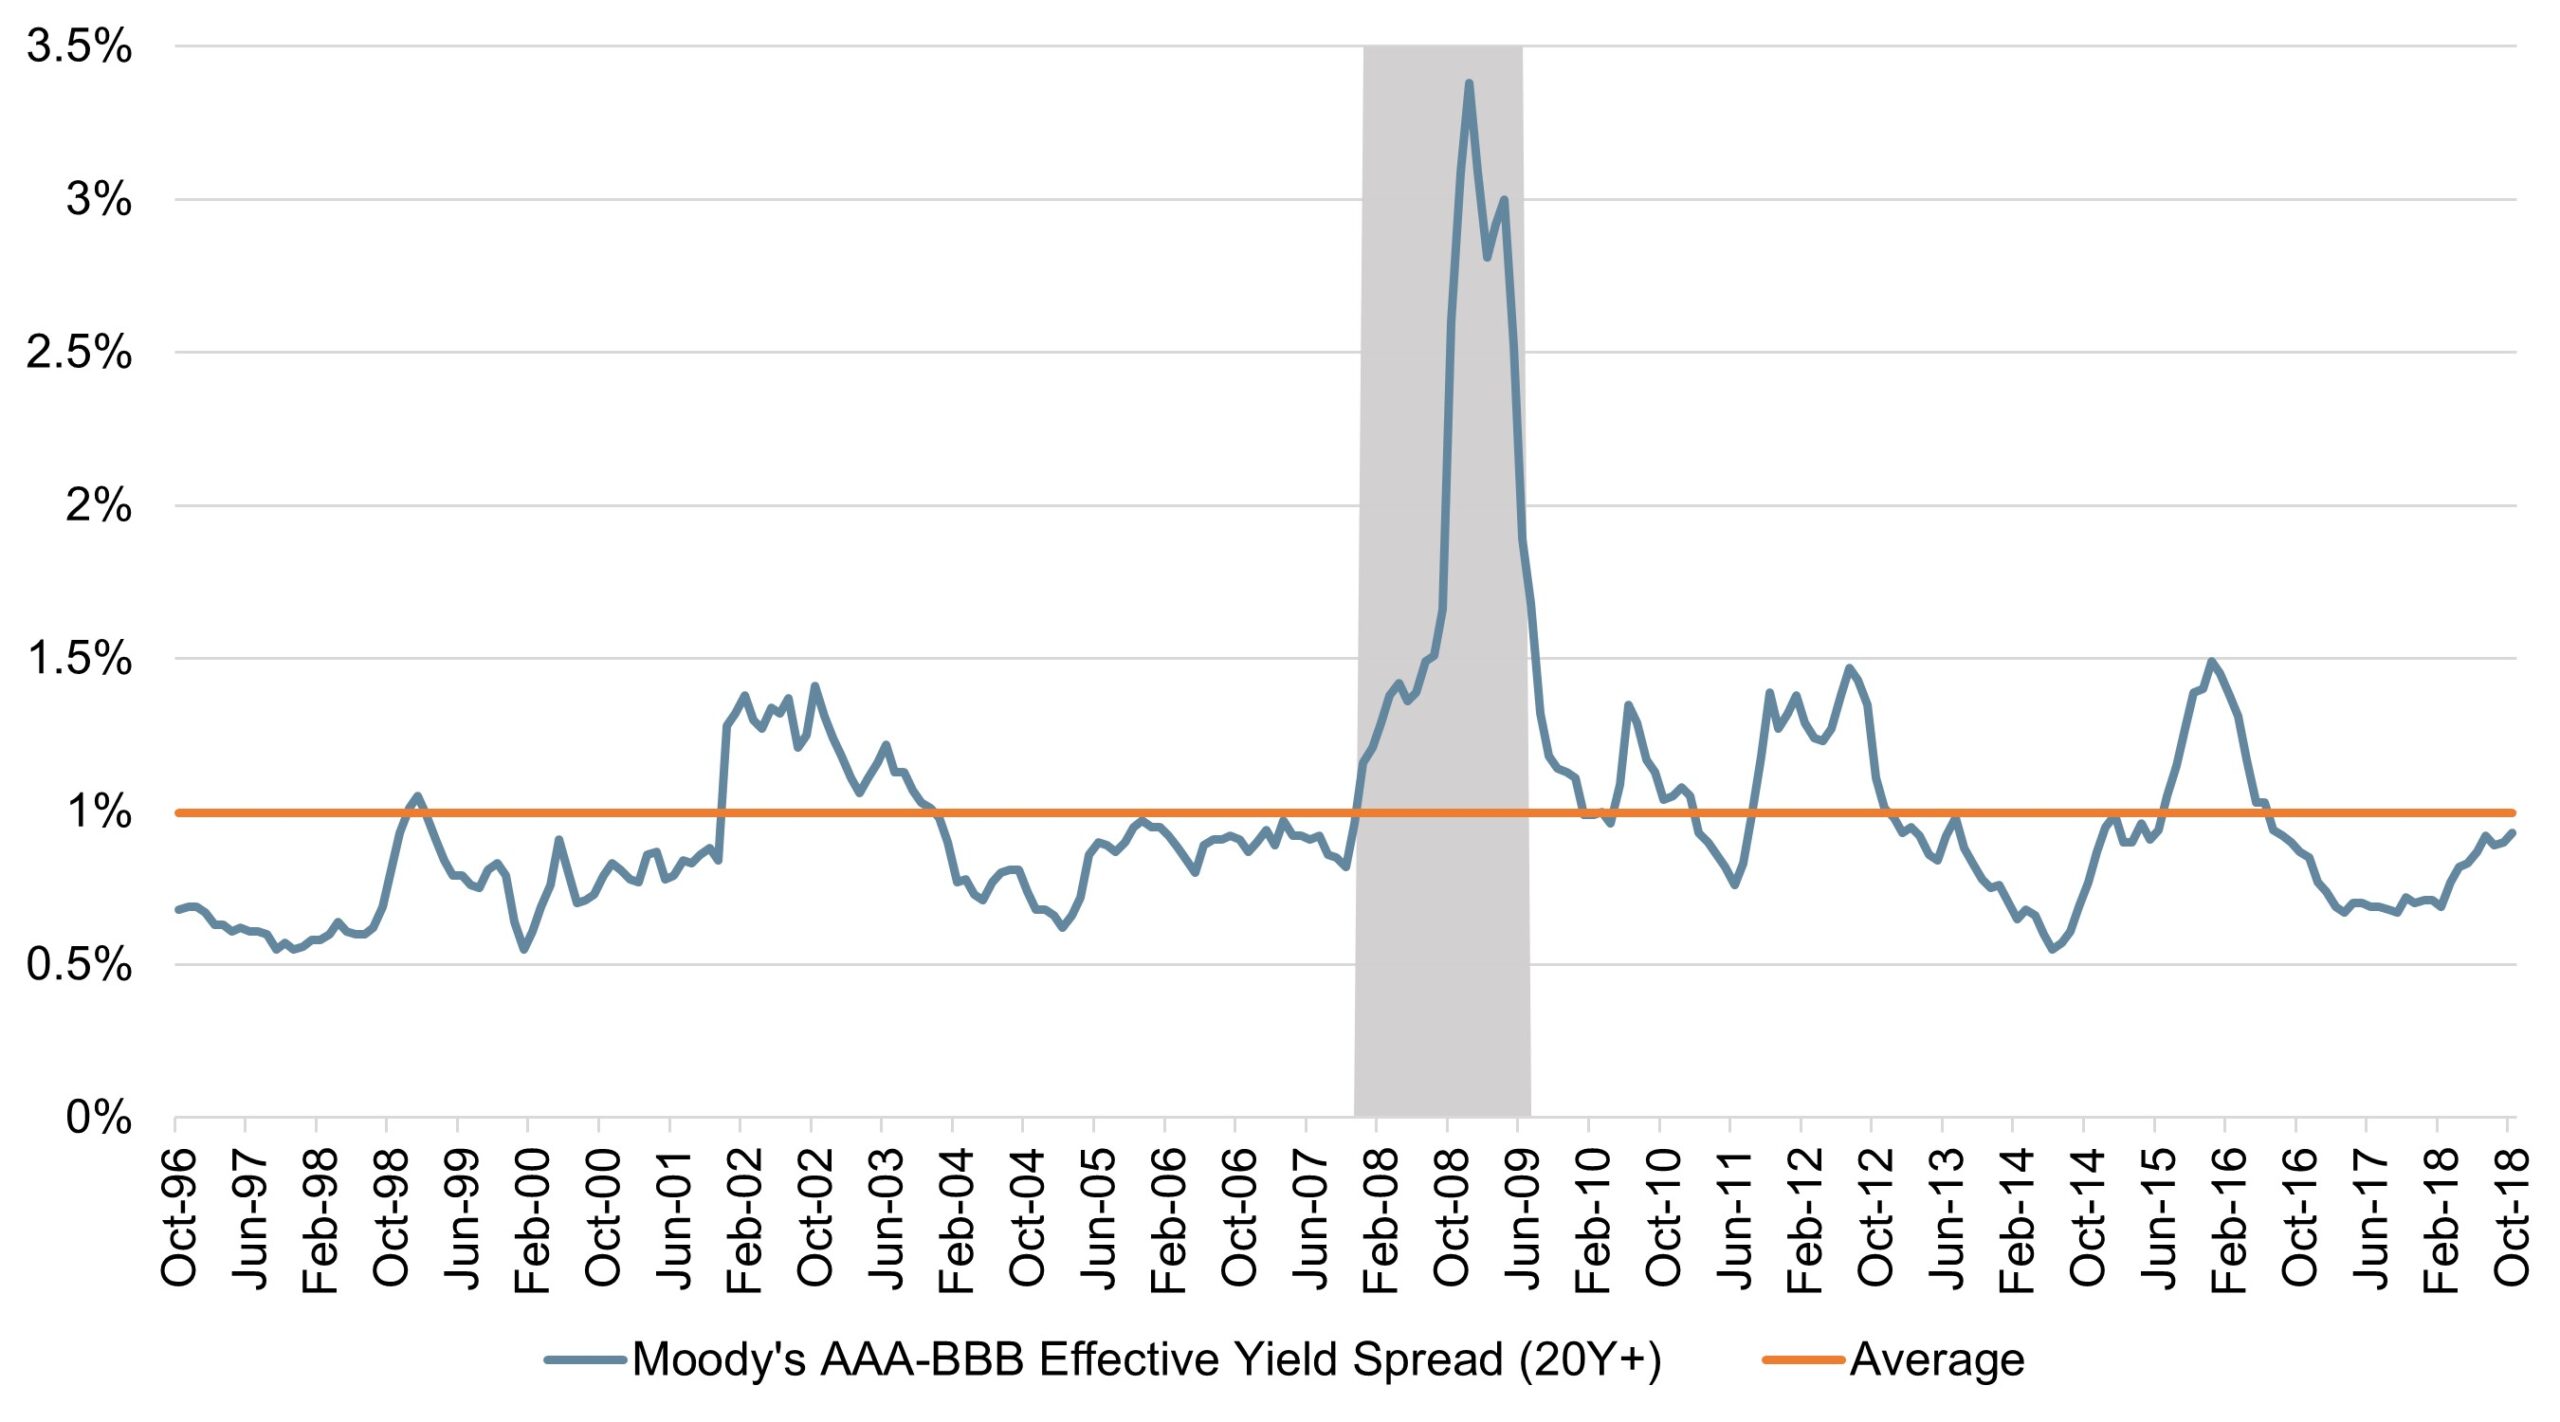
Source: FRED, Federal Reserve Bank of St. Louis
Driven in part by the recent surge in M&A activity, leverage in large US corporates has risen materially (Figure 6). This set of circumstances has stretched debt service metrics (Figure 7) and thereby increased the probability of rating downgrades into the speculative territory once the cycle turns or as rates continue to rise. As is, leniency on the part of credit agencies is what’s allowed lower rated investment grade firms to maintain their ratings while they execute on deleveraging plans.
Figure 6: Levered Up
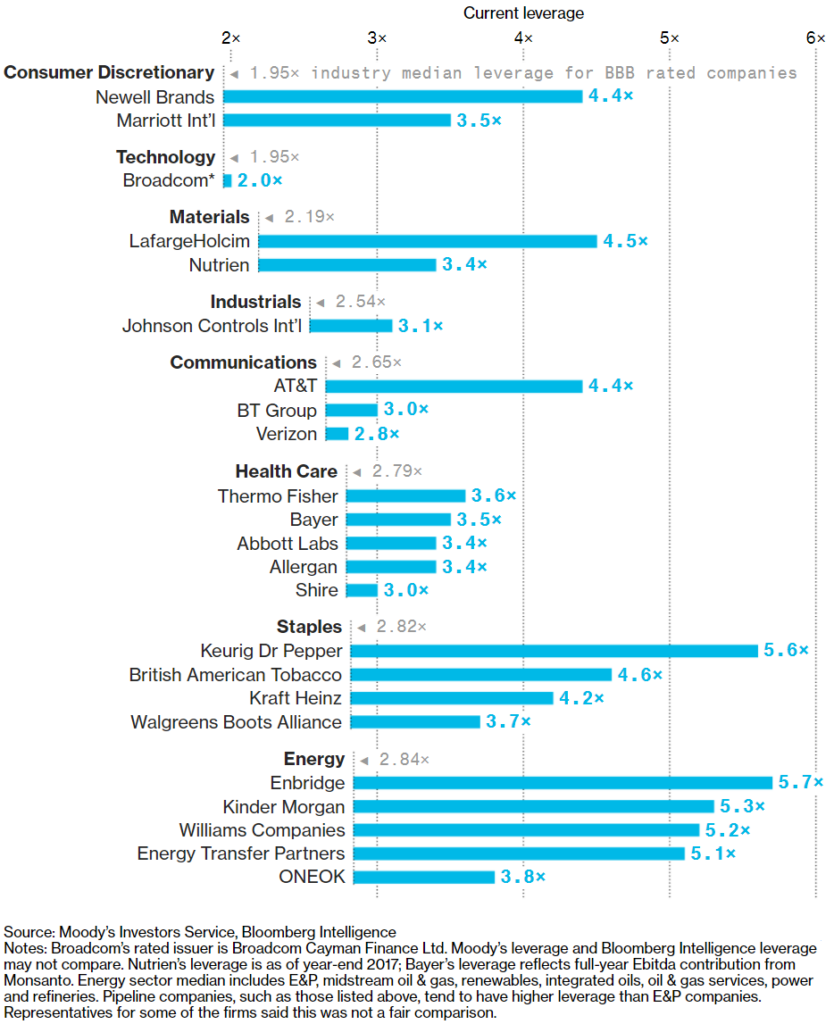
Source: Moody’s Investors Service, Bloomberg Intelligence
Figure 7: Despite Stronger Earnings Growth This Year, Many U.S. Companies Still Struggle with Debt Service
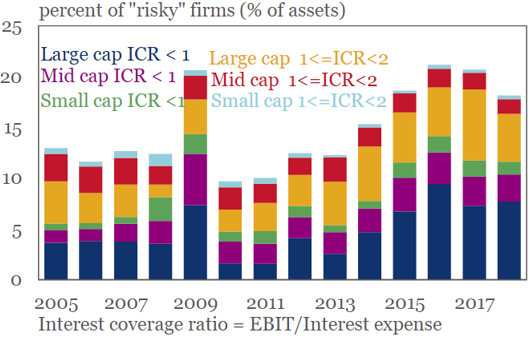
Source: WSJ The Daily Shot, IIF, Bloomberg
While the benign economic environment continues to provide revenue support, these circumstances could imply that downgrades to junk could be substantially higher than historical averages when the business cycle turns. A downgrade to junk status would increase the cost of debt for the newly downgraded firms, placing additional pressure on credit quality. Furthermore, as higher rated firms enter the speculative debt space, existing speculative debt issuers may find it more difficult to borrow. While this may paint a bleak image for the credit outlook of US corporates, companies on the verge of a downgrade to junk status may be able to improve their balance sheets through asset sales.
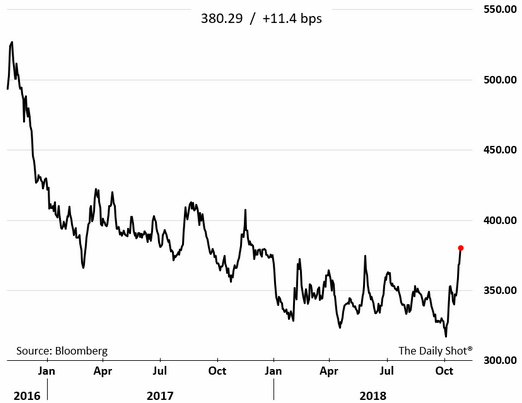
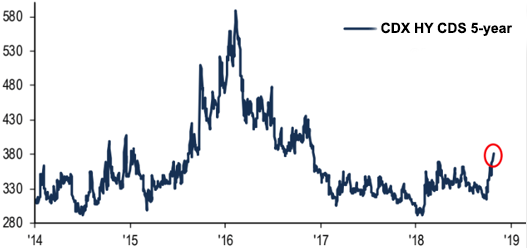
Indications of a turnaround in investor sentiment may already be making their appearance in the higher risk corners of debt markets. Gauges of investors’ required compensation for risk (Figure 8), as well as the cost of insuring high yield debt exposure (Figure 9), both spiked in October.
Figure 8: USD HY All Sectors OAS (bps)
Source: WSJ The Daily Shot, Bloomberg
Figure 9: Cost of Hedging US HY Corporate Bonds at 2-Year High
Source: WSJ The Daily Shot, BofA Merrill Lynch Global Investment Strategy, Bloomberg
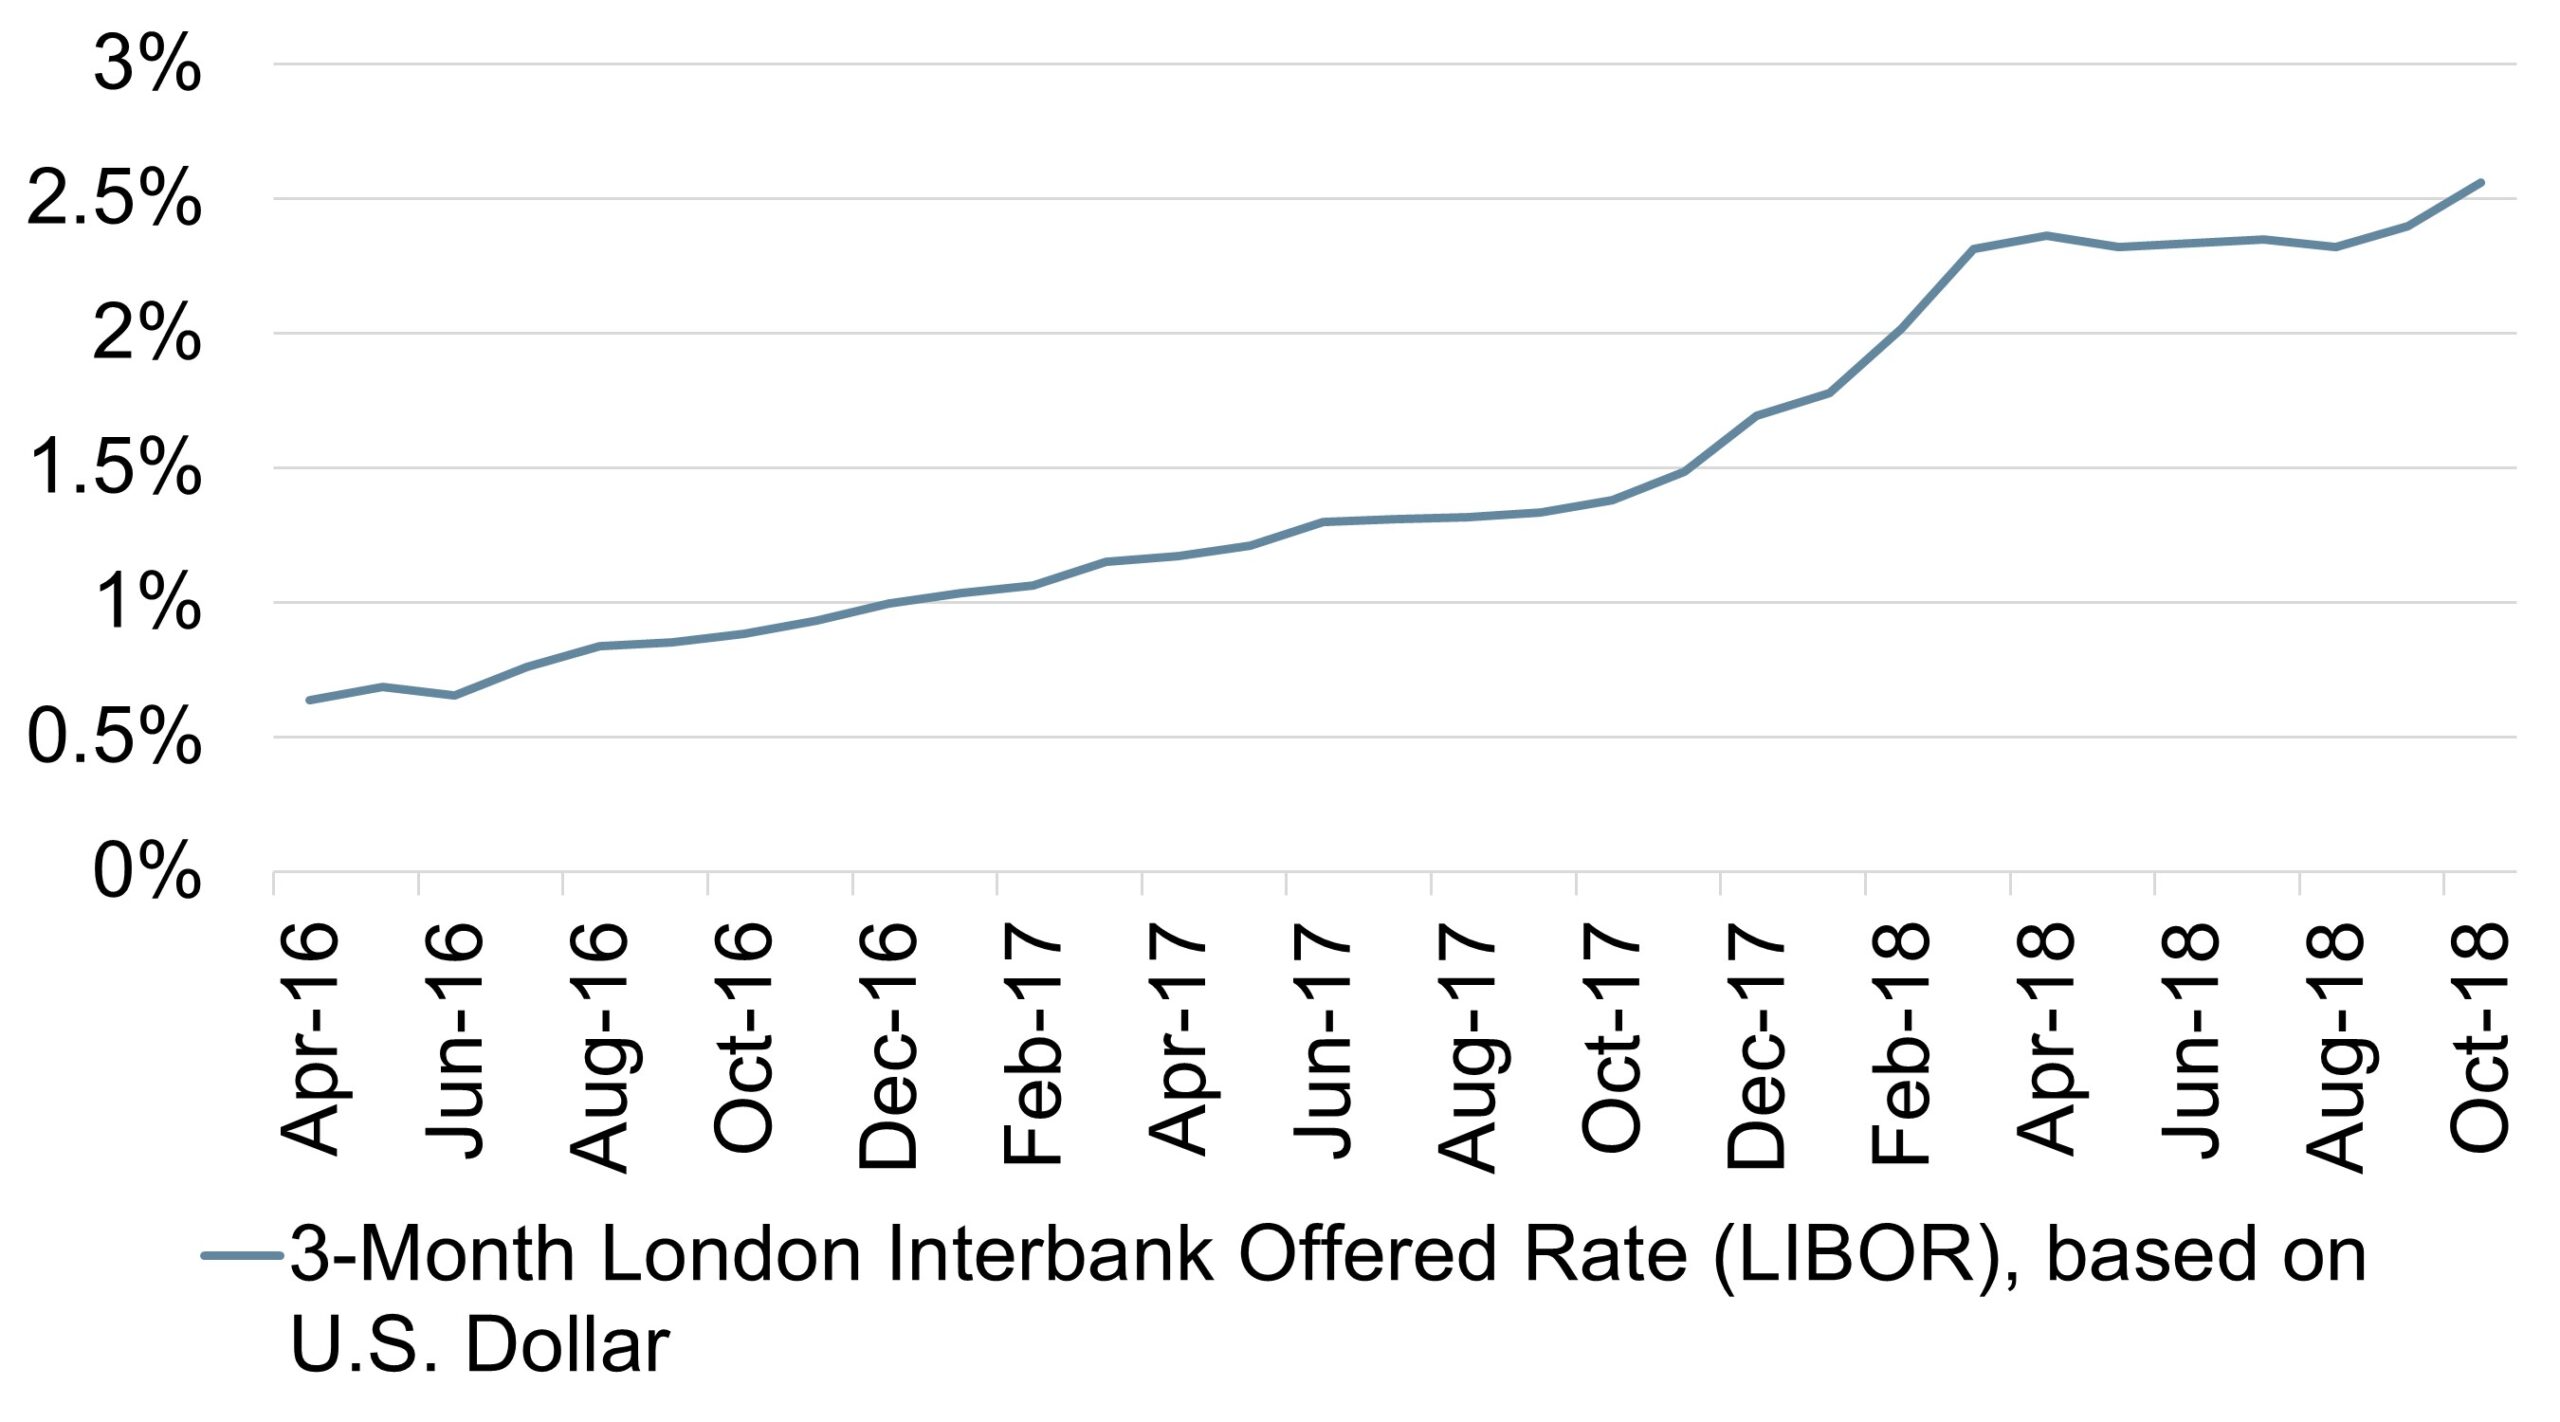
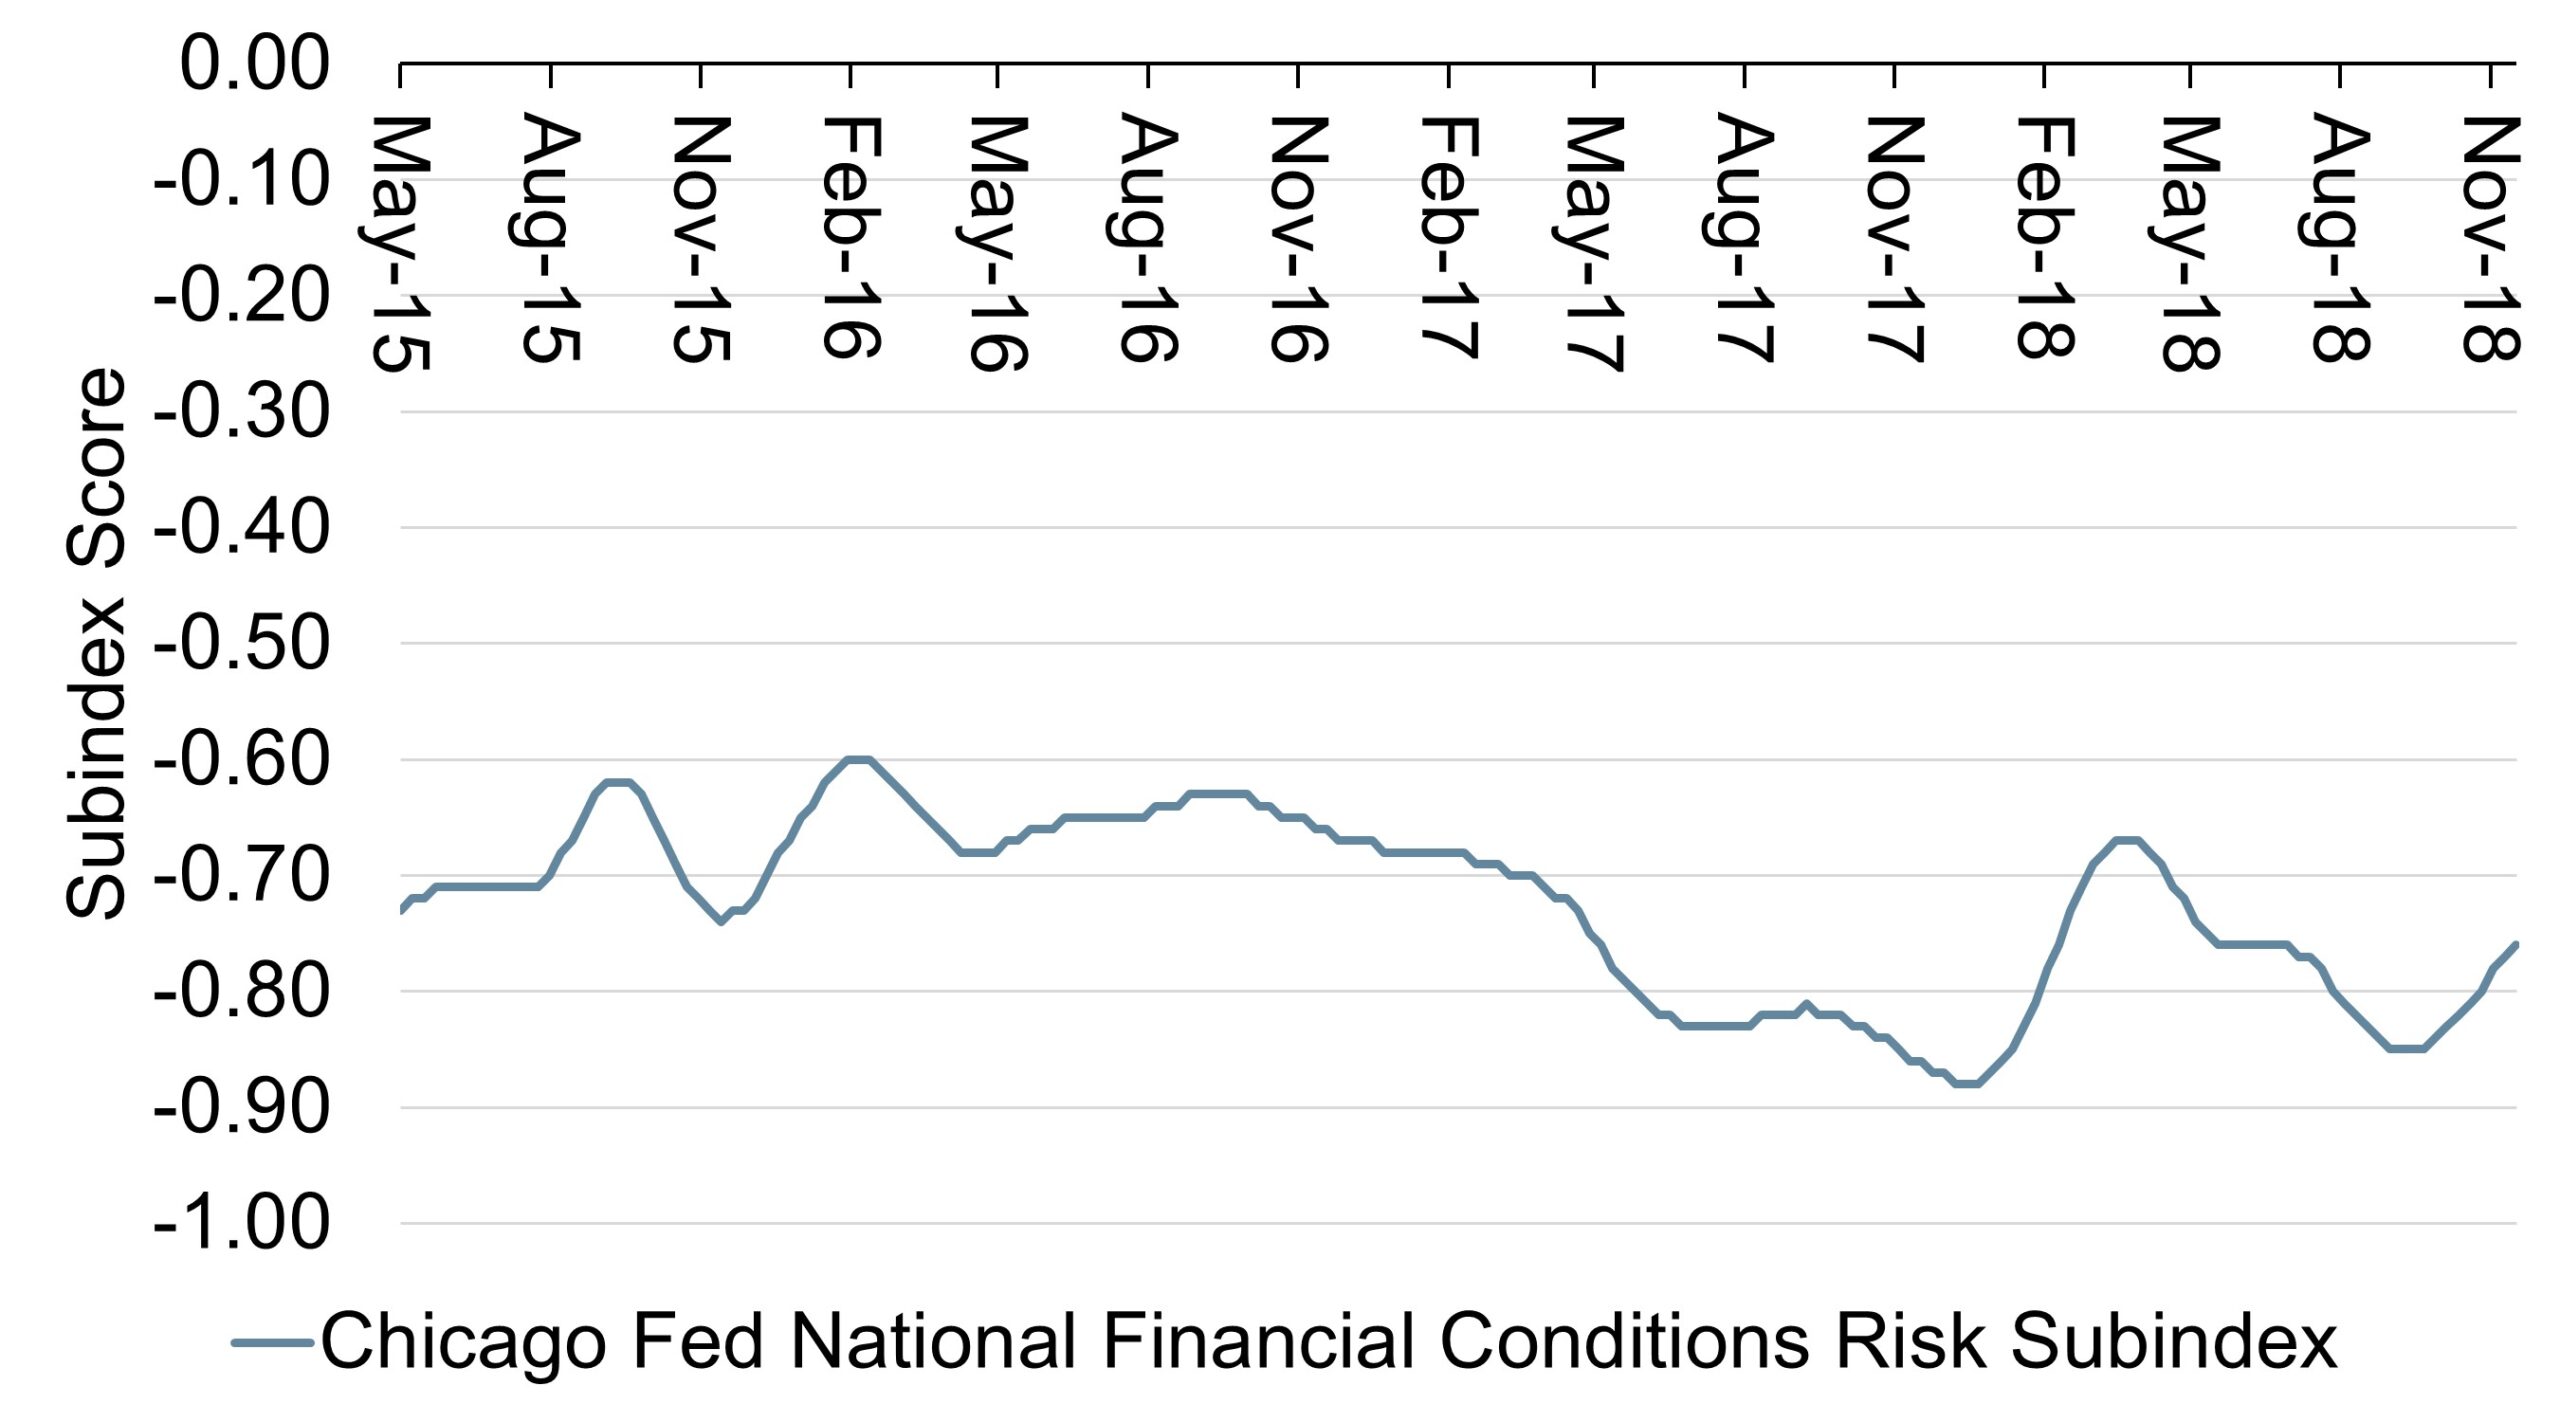
At the same time, benign funding and liquidity conditions in credit markets appear to have started turning the corner. The 3 Month USD Libor has been on an upward trajectory in recent months (Figure 10), while the Chicago Fed National Financial Conditions Risk Subindex, which captures volatility and funding risk in the financial sector, is also indicating a move into a tighter liquidity environment (Figure 11).
Figure 10: 3-Month London Interbank Offered Rate (LIBOR)
Source: FRED, ICE Benchmark Administration Limited
Figure 11: Chicago Fed National Financial Conditions Risk Subindex
Source: FRED, Federal Reserve Bank of Chicago
While this may be nothing more than a realization that the credit cycle is maturing, it serves as yet another indicator that the time for complacency has passed. Investors would do well to increase monitoring and scrutiny of lower rated investment grade firms in their portfolio and be cognizant of potential risks to the credit outlook.
Trade
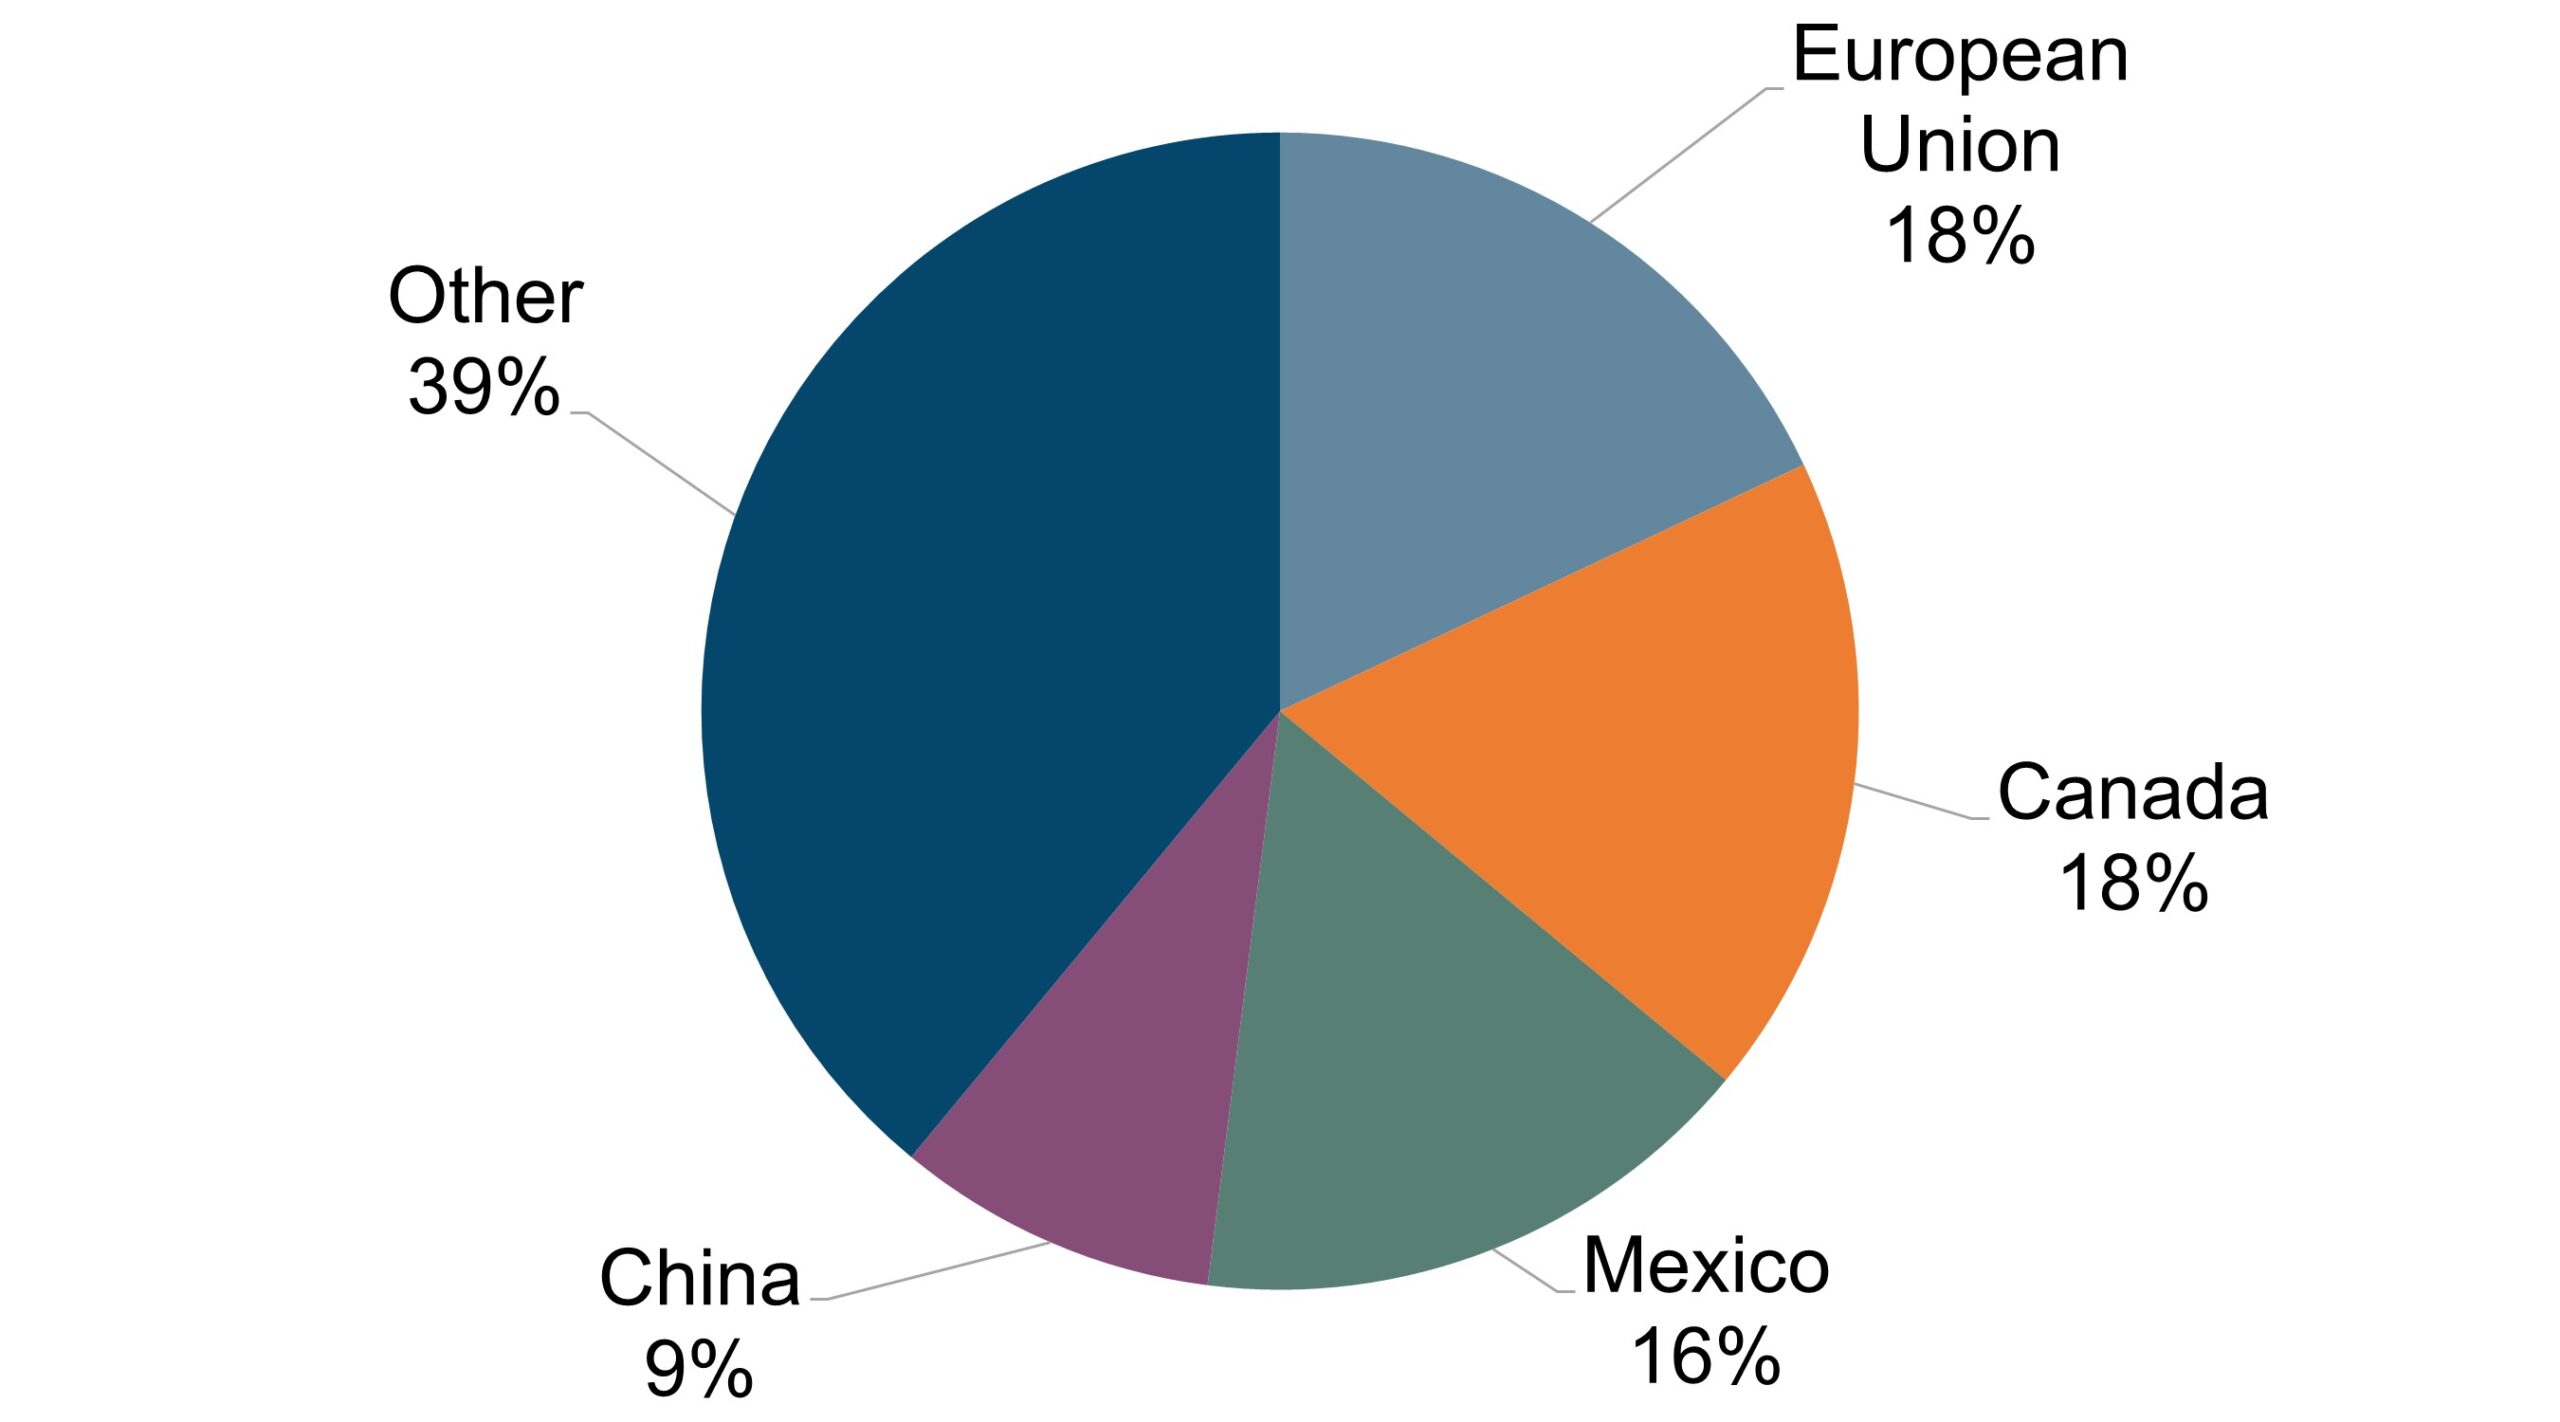
We noted in our April white paper “Tariffs and Trade Wars” that newly implemented trade restrictions were unlikely to have an outsized impact on the U.S. economy’s performance over the near term. And despite its near constant presence in the headlines, nothing implemented since then has materially altered that outlook. The recently-negotiated United States Mexico Canada Agreement (USMCA) stands to remove a significant trade uncertainty while also keeping the core of NAFTA in place. In addition, the provincial agreement between the White House and the EU eased tensions on that end. Taken together, they would leave relations between the US and its three biggest trading partners (Figure 1) relatively unchanged.
Figure 1: U.S. Exports
Source: UN Comtrade, US Census Bureau
The story with China is different. Since April, the White House has imposed a 10% tariff on an additional $200 billion of Chinese goods, set to rise to 25% at the end of the year. China responded in kind, putting 10% tariffs on its remaining untouched U.S. imports (~$60 billion), after which the U.S. threatened tariffs on its remaining $267 billion of Chinese imports. Outside of this, the U.S. Trade Representative has also initiated an investigation into the implementation of auto tariffs.
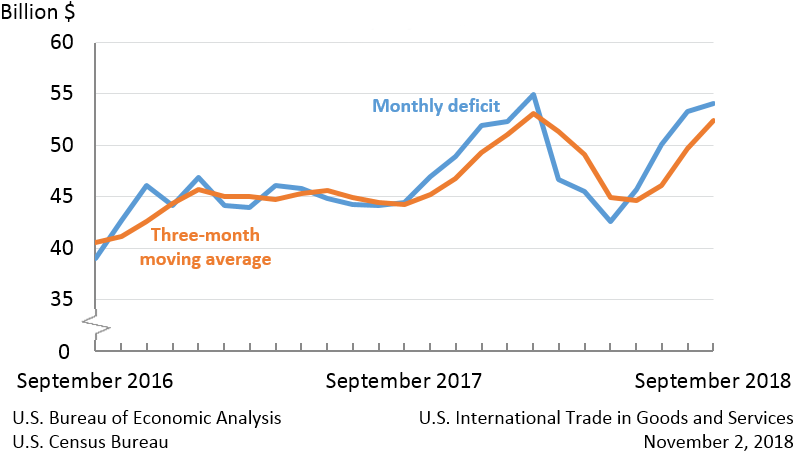
At the macro-level there are two main things to keep in mind. The first is (again) that impacts on short-run growth are likely to be minimal; the Fed and IMF are both predicting domestic growth well north of 2% in 2019 due to other overriding factors. The second is that even as tariffs are likely to impact trade flows, they are unlikely to affect trade deficit levels, which are driven primarily by aggregate savings and investment. In fact, the U.S. trade deficit has widened in recent months due to the impact of increased government borrowing driven by fiscal stimulus (Figure 2).
Figure 2: Goods and Services Trade Deficit (Seasonally Adjusted)
Source: U.S. Bureau of Economic Analysis, U.S. Census Bureau, U.S. International Trade in Goods and Services
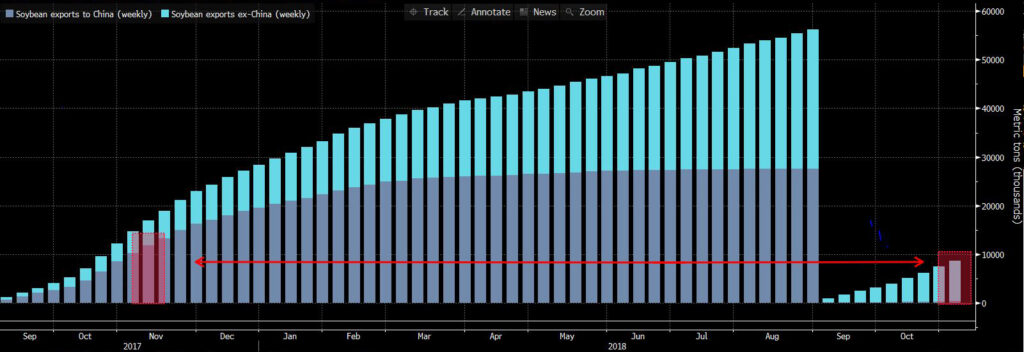
At the sector-level, the implications are more varied. Perhaps no industry has been hit harder than agriculture, specifically soybean farmers. In short, China (which constitutes roughly two-thirds of the global soybean import market) has essentially stopped buying U.S. soybeans. And so far, no other country has compensated for that enormous drop-off in demand (Figure 3). As a result, soybean prices are plummeting, and the USDA is expecting inventories to double by the end of the year.
Figure 3: Slow Build – Accumulated U.S. Soy Exports Show Rest of the World Can’t Fill China Demand Gap
Source: USDA, Bloomberg LP
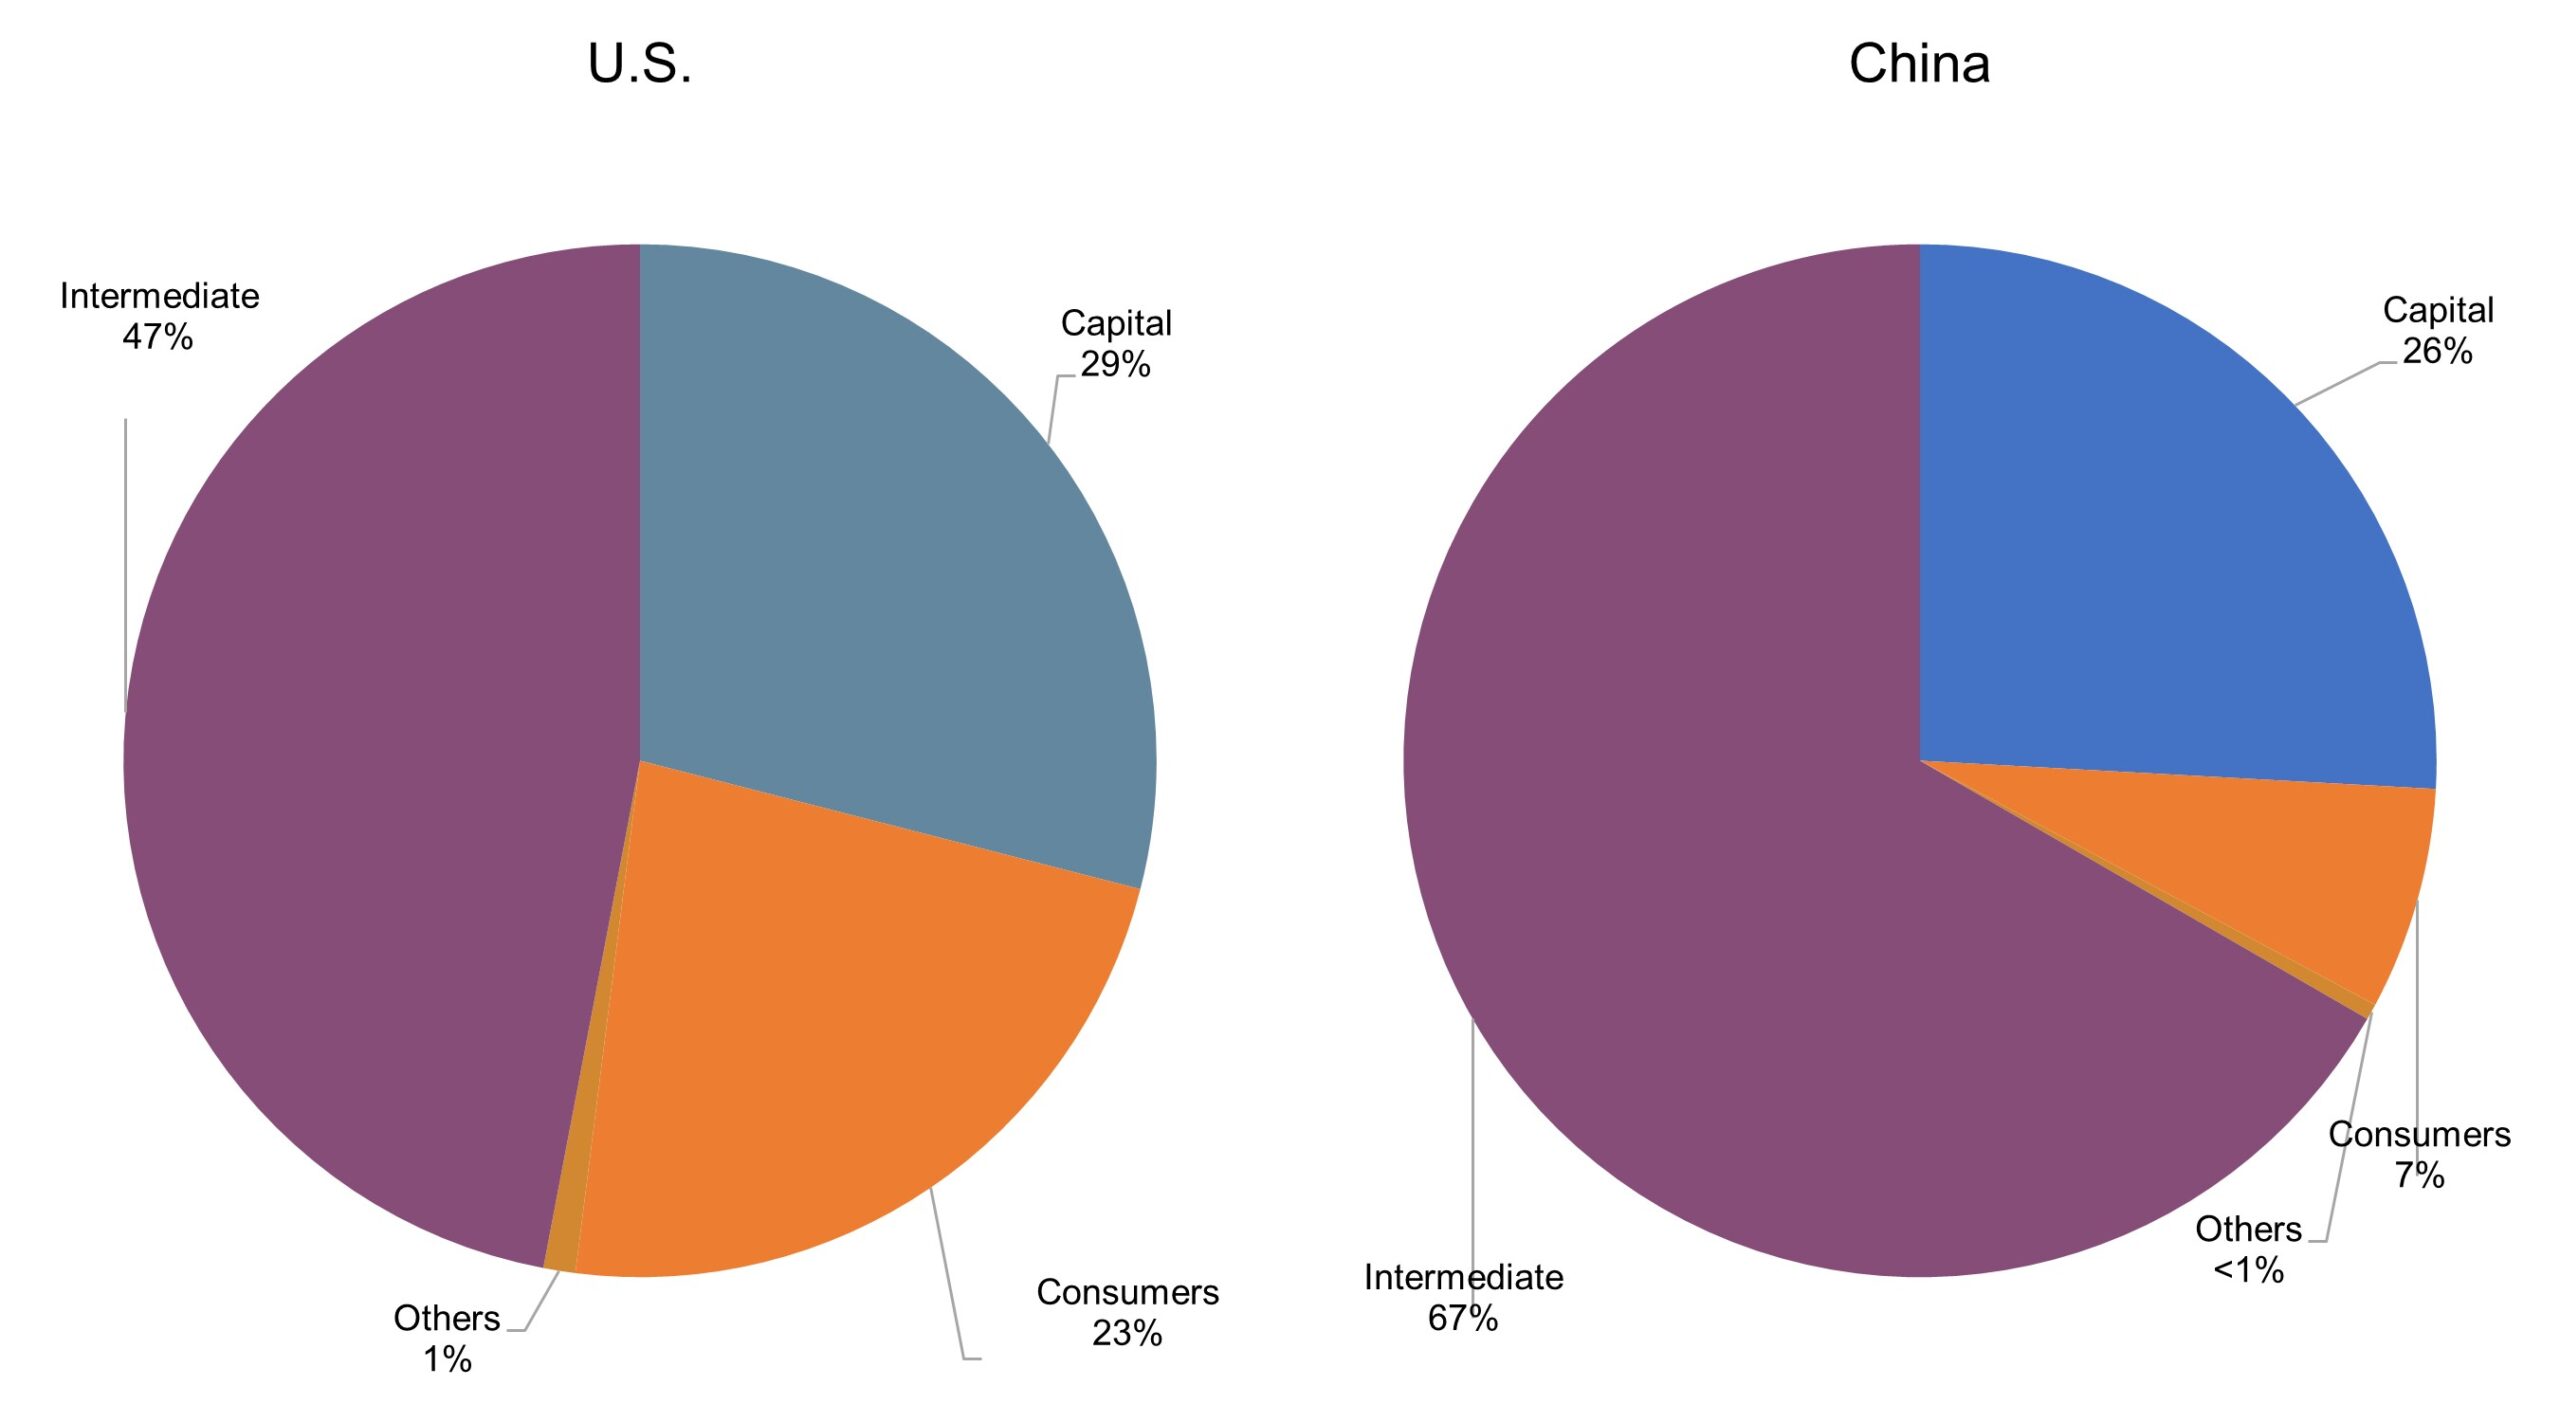
Outside of agriculture, the impact is being felt by manufacturing, telecommunications and construction firms that have global supply chains. According to the Fed’s October Beige Book, firms in these sectors have already reported facing higher raw materials costs due to existing tariffs. And given the most recent tariffs’ focus on intermediate goods rather than consumer products (Figures 4 & 5), these firms will likely face additional cost pressure going forward.
Figure 4 & 5: Import Tariffs for U.S. and China (by Types of Goods)
Source: Moody’s Investors Service
With the rising cost of inputs, firms in these sectors will likely need to adjust existing supply chains. This is especially true for companies, such as electronics manufacturers, which face the reality of being hit by tariffs at both the U.S. and Chinese borders. One advantage the U.S. manufacturing base has is that it is generally high value-add, with less competition and wider margins than the relatively lower value-added activities in China. As such, it should be easier to pass on higher input costs to customers. Additionally, U.S. manufacturing companies are generally well-diversified and not-overly reliant on Chinese demand. Therefore, the tariff impact should be manageable for the time being.
A greater threat stems from potential auto tariffs, which President Trump has floated. A 25% tariff on automobile imports would significantly compress margins for foreign carmakers doing business in the U.S. For instance, Toyota estimates that it would add nearly $6,000 to the cost of each vehicle it sells here. This could be partially mitigated by increasing production within the U.S.; automakers such as Hyundai and Kia are already moving in this direction. However, doing so is both time and capital intensive.
Meanwhile, auto tariffs are the most sensitive pain point for the EU, which values its core German and Italian manufacturing bases. European automakers are in a slightly better position than their Japanese and Korean counterparts given that they aren’t as reliant on U.S. sales. Nonetheless, it’s highly likely that if the U.S. were to implement auto tariffs, the EU would reciprocate in order to protect its auto industry.
Conclusion
Financial markets may be coming out of a long period of extraordinary calm and unhindered economic growth. While so far, this has boded well for investors and the economy at large, this environment risks creating a false sense of security. As the expansion reaches its later stages, indications of a ‘return to normalcy’ have been making their appearance. In this whitepaper we looked at three themes affecting the current and future economic outlook and evaluated their implications for investors. The resurgence of market volatility, the tightening of credit conditions, and the uncertainty around trade policy should motivate investors to take a closer look at their exposures and better understand the risk factors governing their performance going forward. While this by no means points to a doom-and-gloom scenario for the near future, now might be the time to put on the old risk manager’s hat. After all, it bears remembering that there are cohorts of market participants out there that have never actively experienced a mature expansion.
Our research is for personal, non-commercial use only. You may not copy, distribute or modify content contained on this Website without prior written authorization from Capital Advisors Group. By viewing this Website and/or downloading its content, you agree to the Terms of Use.
Please click here for disclosure information: Our research is for personal, non-commercial use only. You may not copy, distribute or modify content contained on this Website without prior written authorization from Capital Advisors Group. By viewing this Website and/or downloading its content, you agree to the Terms of Use & Privacy Policy.
