Parsing the Red Sea Disruptions
Following pandemic-era supply chain disruptions, bottlenecks have become a top-of-mind subject for investors. At the center of the Fed’s tightening cycle was the soft landing—the idea that tighter financial conditions would help bring supply-and-demand into better balance, ease bottlenecks, and bring inflation toward 2% without significantly impacting growth. When last December’s Summary of Economic Projections (SEP) all-but-confirmed that the tightening cycle was over, all eyes turned towards the Fed’s first rate cut. Initially, markets eagerly priced in as many as six cuts in 2024 , twice the amount expected by the Fed. Lurking in this optimism, however, lies an echo of pandemic-era disruptions arising from the Red Sea that risks bringing back cost pressures which many investors hoped had passed. This, in turn, could affect the central bank’s rate path.
What happened in the Red Sea?
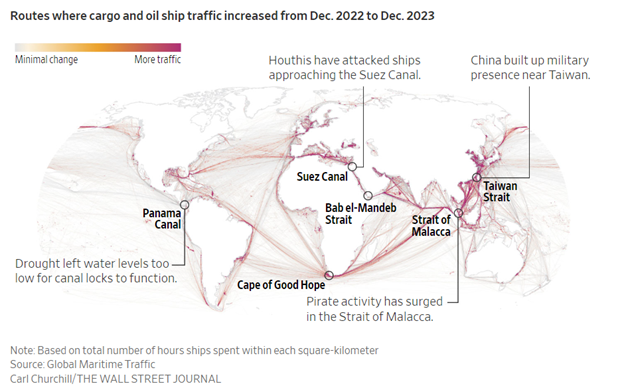
In November 2023, the Houthis, a rebel group in Yemen backed by Iran, hijacked a cargo ship in the Red Sea that they claimed has ties to Israel. The group went on to say that they would continue to target Israeli-linked vessels in retaliation to Israel’s attacks on Gaza. In practice, the group has cast a relatively wide net, attacking a number of ships with little to no connection to Israel.1 As a result, major companies like Maersk and BP have avoided sending ships through the Red Sea and Suez Canal.
Red Sea Disruptions and Global Exposure Levels
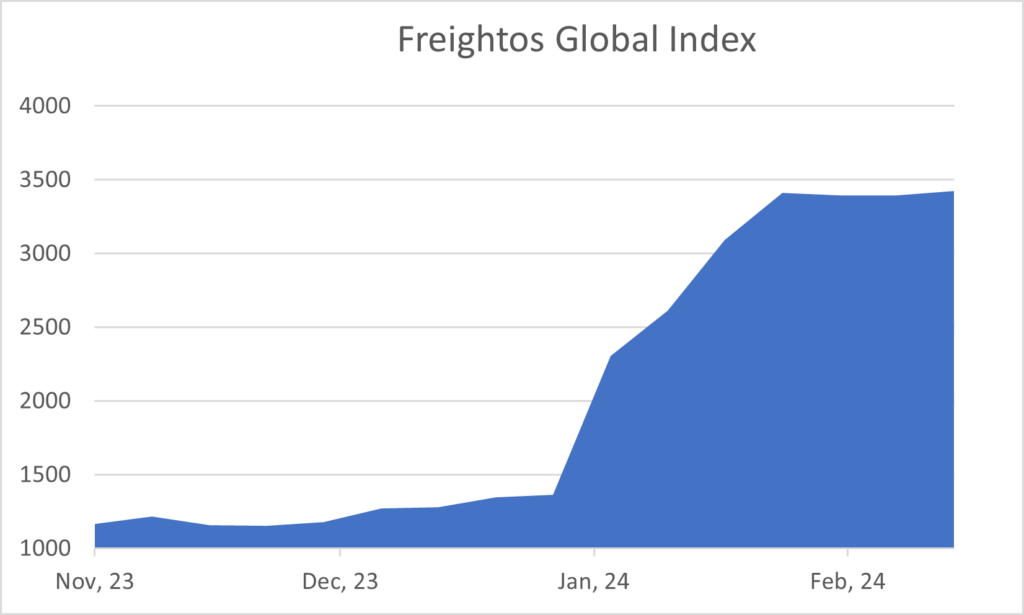
The most material effects stemming from the Red Sea disruptions have been on shipping times and insurance, and therefore costs. Around 15% of global shipping traffic and 30% of container traffic typically passes through the Red Sea and Suez Canal,2 but this activity is down to about 20% of normal levels.3 In diverting shipping, companies have opted for alternative routes such as passage around the Cape of Good Hope, which can increase shipping times by 40-50%.45The knock-on effect is that the cost of shipping, according to the Freightos Global Container Index, has roughly tripled since November as a result of longer travel times and higher insurance costs.

Source: Freightos, Bloomberg

Source: Wall Street Journal
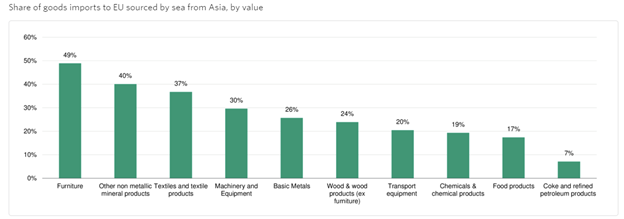
In terms of economic impact, Europe is the most vulnerable to disruptions to Suez traffic, with around 20% of the EU’s goods coming through the Red Sea. The largest share of these goods are furniture, apparel, machinery, iron and steel, among others.6 Broadly speaking, having to divert ships around Africa largely impacts the cost of core goods.

Source: Moody’s Investor Services, Eurostat
Potential Impact on The Economy
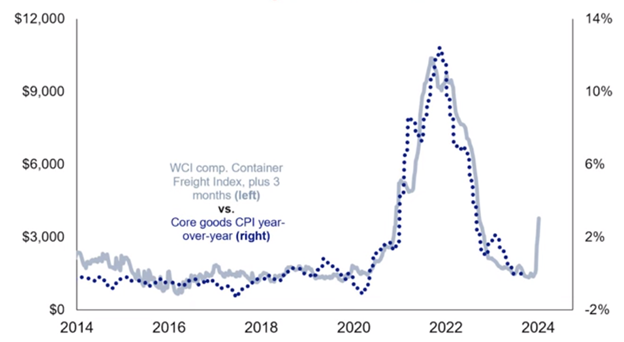
Assuming producers pass the increase in shipping costs to the consumer, core inflation, especially in Europe, could increase. This would offset the deflation in goods that has helped bring headline inflation down considerably in the last year. In January, Allianz Trade estimated that the doubling of freight costs for Europe sustained for more than three months could push Eurozone inflation up by 0.75% and reduce growth by almost 1%.7 Globally, JPMorgan’s estimates a more modest impact from shipping costs, predicting a 0.7% increase in core goods prices and a 0.3% increase in core inflation.8
As of yet, energy prices have not been materially impacted. Longer shipping times are estimated to have added only $2/bbl to oil prices.9 An influx of non-OPEC supply has helped to temper oil prices despite cuts from OPEC+ producers. However, oil markets are not completely insulated, as evidenced by the attack on the oil tanker M/T Pollux
While there is some upside risk to inflation, credit risk appears to be minimal. Pandemic bottlenecks were a costly lesson, but one that many companies learned, and, as a result, have been largely successful in navigating the Red Sea disruptions. Moreover, the economy is not running as hot as it was in the pandemic-era zero-rate environment, meaning that inflation implications are less severe because central bank policies are already putting pressure on the brakes
More likely, prolonged or exacerbated disruptions could have a greater impact on interest rates. Even a relatively small uptick in headline inflation could alter the Fed’s plan to cut rates, particularly if other economic indicators remain robust. At the January 2024 FOMC press conference, Jerome Powell said that the Committee requires “greater confidence that inflation is moving sustainably toward 2%” before they consider cutting rates. Given that the Fed projects headline PCE to fall to 2.4% by the end of 2024 (compared to 2.6% reported in December-23), inflation moving in the wrong direction could give the Fed pause when they consider cutting, potentially cutting less or later than planned.

Source: Strategas Research Partners
The Bottom Line
The challenge with soft landings is that they are easy to derail—out of the last six tightening cycles in the U.S., four ended in recession.10 However, Jerome Powell’s Fed seems to have largely succeeded so far, with inflation, as indicated by the PCE price index, standing at 2.4% year-over-year as of Jan 2024 versus its 7.1% peak in 2022. Additionally, GDP grew a robust 3.1% in 2023, and unemployment has remained below 4%. That being said, the market’s initial expectations for the Fed Funds rate implied by the futures market left very little margin for error. In other words, any continued stubbornness with inflation and the labor market would jeopardize substantial rate cuts, and that’s exactly what happened. Following a strong payrolls report and a higher-than-expected CPI figure in January, the Fed Funds Futures market priced out two cuts, and moved the expected first cut from March to June. Although market expectations are now closer to the Fed’s, Powell has played down the importance of rigid projections, instead focusing on agile data dependence.
Ultimately, interest rates will likely remain volatile as the market weighs economic data and tighter policy against forecasted moves in interest rates. While the Red Sea hasn’t significantly impacted the Fed’s path yet, investors looking at extending duration should continue to monitor freight costs and core goods inflation when considering the magnitude of the Fed’s cutting cycle.
1BBC. (2024, February 5). Who are the houthis and why are they attacking Red Sea ships?. BBC News. https://www.bbc.com/news/world-middle-east-67614911
2Premack, R. (2024a, January 10). We got too accustomed to peaceful seas. FreightWaves. https://www.freightwaves.com/news/we-got-too-accustomed-to-peaceful-seas
3Kiel Trade indicator 2/24: Freight volume in the Red Sea continues to decline, fewer ships in Hamburg. Kiel Institute. (2024, February 7). https://www.ifw-kiel.de/publications/news/freight-volume-in-the-red-sea-continues-to-decline-fewer-ships-in-hamburg/
4Eavis, P., & Bradsher, K. (2024, January 6). Red Sea attacks leave shipping companies with difficult choices. The New York Times. https://www.nytimes.com/2024/01/06/business/red-sea-shipping-houthi.html#:~:text=MSC%2C%20the%20largest%20container%20shipping,the%20Maersk%20Hangzhou%2C%20was%20attacked.
5Fitch Solutions, Fitch Ratings. (2024, January 12). Container Shipping: Red Sea Conflict – Rate Impact. CreditSights. https://v2.creditsights.com/articles/556094
6Moody’s Analytics. (2023, December 18). Supply chain risks in focus as shipping companies divert after Red Sea attacks. Moody’s . https://www.moodys.com/research/Maritime-Shipping-Europe-Supply-chain-risks-in-focus-as-shipping-Sector-Comment–PBC_1392404
7Hannon , P., & Boston , W. (2024, January 19). The Red Sea conflict is scrambling shipping. Europe is … The Wall Street Journal . https://www.wsj.com/world/europe/the-red-sea-conflict-is-scrambling-shipping-europe-is-bearing-the-brunt-a0aac0e3
8Hannon , P. (2024, January 24). The Middle East Crisis is starting to weigh on the economy. The Wall Street Journal . https://www.wsj.com/business/logistics/the-middle-east-crisis-is-starting-to-weigh-on-the-economy-6c2302a1
9Henderson , B. (2024, January 29). Why oil prices rose after shrugging off a crisis. The Wall Street Journal . https://www.wsj.com/finance/commodities-futures/oil-prices-increase-charts-red-sea-crisis-297fdd01
10Kliesen, K. L. (2023, August 14). Gauging the Fed’s current tightening actions: A historical perspective. Saint Louis Fed Eagle. https://www.stlouisfed.org/on-the-economy/2023/aug/gauging-fed-current-tightening-actions-historical-perspective#:~:text=In%20four%20of%20the%20previous,exceeds%20its%20potential%20growth%20rate.
Please click here for disclosure information: Our research is for personal, non-commercial use only. You may not copy, distribute or modify content contained on this Website without prior written authorization from Capital Advisors Group. By viewing this Website and/or downloading its content, you agree to the Terms of Use & Privacy Policy.
