
On a Path to Return on Investments
Abstract
The return of yield opportunities presents institutional cash investors with fresh challenges. Higher rates have driven up the cost of staying with ultra conservative instruments. Money market fund reforms have left corporate cash managers with few clear choices to add yield. And historically popular cash vehicles that have undergone significant changes demand a fresh look. After revisiting several investment scenarios with updated income figures, we suggest that a multi-pronged investment strategy, including separately managed accounts (SMAs), may help improve one’s risk/reward profile.
Introduction
In the years after the 2008 financial crisis, the Federal Reserve maintained a zero- interest-rate policy (ZIRP) to boost economic recovery until December 2015, when it slowly started to lift the short-term rates off the floor. When risks were plentiful and yield was nonexistent, institutional cash investors were concerned with the return of their investments, meaning principal preservation, than with traditional return on investments.
In February 2012, we published a whitepaper titled “All Pain, No Gain” that discussed several types of stylized cash vehicles with vastly different risk profiles but essentially the same return profile – zero. Now, with the Federal Reserve well on its way to interest rate normalization, we thought it appropriate to revisit the subject, identify changes in risk/reward characteristics of several sample portfolios, and discuss ways to improve their risk/reward balance.
Tales of Four Cash Investors
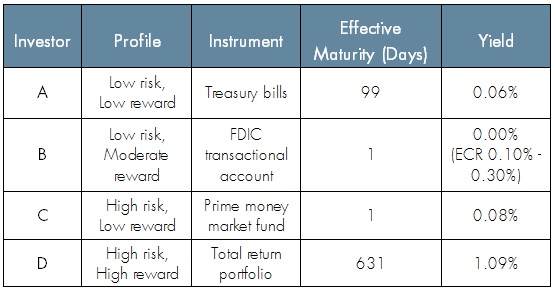
To illustrate the risk/reward tradeoffs, we presented four hypothetical investors’ cash vehicles as of 1/31/2012 below (with edits):

Investor A: Balances were entirely in U.S. Treasury bills as represented by the BofA Merrill Lynch US Treasury Bill Index. The portfolio had an average maturity of 99 days and yielded 0.06%.
Investor B: Balances were entirely in an FDIC-insured, non-interest bearing transactional account. The depositor earned an estimated effective earnings credit rate (ECR) of 0.10% – 0.30%. No industry information is available on ECRs. The FDIC program expired at the end of 2012.
Investor C: Balances were entirely in an institutional prime money market fund represented by the Crane Data Prime Institutional MF Index with an effective overnight maturity that yielded 0.08%.
Investor D: Balances were entirely in an index-tracking account consisting of government, corporate, financial, mortgage-backed and asset-backed securities as represented by the BofA Merrill Lynch 1-3 Year US Broad Market Index yielding 1.09%. Its effective maturity was 631 days.
The stylized table covered a wide spectrum of cash investors. Except for D, real-world investors lay along different points of the “pain” scale, while the “gain” scale was almost indistinguishable from each other. We presented D to showcase a total return-oriented investor who assumed more risk to add yield.
DOWNLOAD FULL REPORT
Our research is for personal, non-commercial use only. You may not copy, distribute or modify content contained on this Website without prior written authorization from Capital Advisors Group. By viewing this Website and/or downloading its content, you agree to the Terms of Use.
Please click here for disclosure information: Our research is for personal, non-commercial use only. You may not copy, distribute or modify content contained on this Website without prior written authorization from Capital Advisors Group. By viewing this Website and/or downloading its content, you agree to the Terms of Use & Privacy Policy.
