Oil Markets in Flux
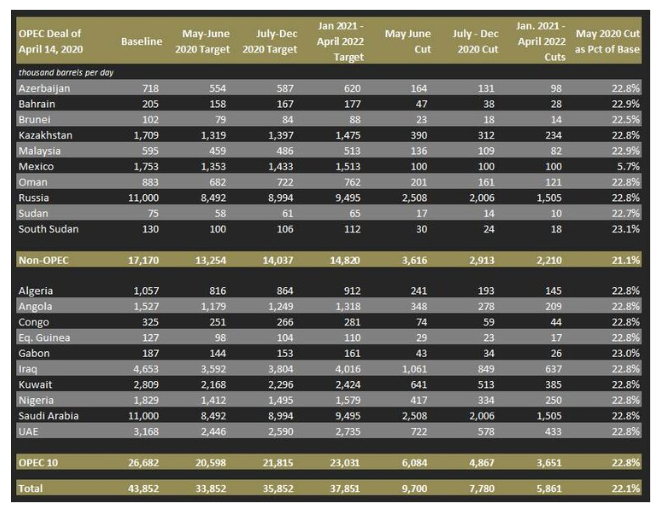
The oil and gas industry is being hit hard from all sides, with a historic glut and a collapse in demand for oil occurring simultaneously. Given the current situation, drastic production cuts across the world will be necessary to support the oil market and limit its inevitable ripple effects on the broader world economy. While OPEC+ has committed to a 9.7 million barrel cut per day, this does little to narrow the spread between global demand and supply. Whether the U.S., and more specifically oil-rich regions across the U.S., mandate production limits is also a question, given large-scale opposition to the move as well as the unknown long-term consequences of such a decision. Nonetheless, action must be taken, and production limits enforced.
OPEC+ Deal Implications
On April 14th, OPEC+ agreed to historic production cuts totaling an initial 9.7 million barrels per day through June. After June, the production cuts are phased down with cuts falling to 7.8 million barrels per day from July-December, and 5.9 million from January-April 2021. Despite the undoubted achievement this agreement represents, analysts are concerned that supply will still far outweigh demand, especially in the later months. As a result of the delay in initiating the cut, current inventories were allowed to build for longer, and at a faster rate than if the deal had been implemented earlier. Using up accumulated inventory will take time, with a prolonged period of low oil prices being the likely consequence.
Furthermore, summing up the normal daily production levels of all the countries involved in the OPEC+ deal yields 44 million barrels, which is less than half of the more than 100 million barrels produced globally each day. Even including the U.S., who produced just over 12 million barrels per day as of April 2020, the number of players involved does little to suggest that large enough production cuts could be made. Adding to that, the U.S. has not committed to explicit production cuts at this point, taking the view that market forces will naturally stem outflow. Without the involvement of the U.S., the world’s biggest producer, other non-OPEC countries are unlikely to participate. And though they have set expectations that reflect declines in production, Canada, China and Brazil, which accounted for about 5%, 5%, and 4% of daily world production pre-COVID-19, respectively, are also notably not involved in the deal.
Figure 1

Source: Princeton Energy Advisors
Exacerbating the situation further, Saudi Arabia had already loaded up tankers carrying a cumulative 32 million barrels of oil to the U.S prior to cutting the deal. The tankers began to arrive in April and will continue through the end of May. This influx will further pressure prices, and push U.S. producers to shut-in wells. While President Trump has said he will look into a proposal to block the oil shipments to the U.S., there are no details yet.
North American Production
The situation in the U.S. is dire. According to the U.S. Energy Information Administration (EIA), in the first quarter of 2020, global petroleum and liquids fuel consumption averaged 94.4 million barrels per day, reflecting a 5.6 million barrel per day decline year-over-year. In the U.S., the EIA predicts demand will drop by over 1 million barrels per day. This compares to the estimate that in 2019, consumption of petroleum per day averaged about 20.46 million barrels, with the update reflecting a significant drop in demand levels. In addition to rapid declines in demand, storage space is rapidly filling, with much of the remaining storage locked in through contracts.
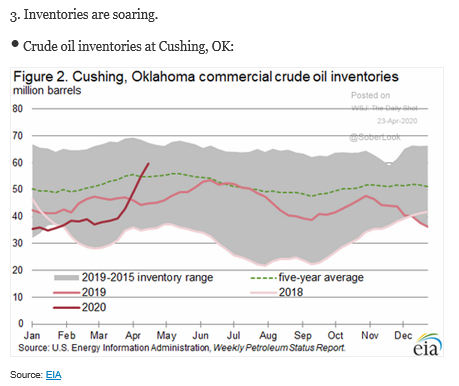
Buyers have few places to put oil besides storing it, with Cushing, Oklahoma being the main place in the U.S. tasked with that job. The farm has about 76 million barrels of working capacity, with almost 58 million barrels stored there as of the week ending April 17th, according to The American Petroleum Institute. Though the tanks are not physically full yet, the remaining space has been fully leased out to producers and traders intending to fill them soon. As seen below in Figure 2, working storage capacity is going rapidly.
Figure 2

Source: U.S. Energy Information Administration, WSJ Daily Shot, 4/23/2020
The Strategic Petroleum Reserve, established to reduce the impact of disruptions in supply of products, maintains stocks in underground salt caverns at four sites along the coast of the Gulf of Mexico (two sites in Texas, two in Louisiana). Authorized storage capacity is 713.5 million barrels, with inventory levels at 635 million barrels as of April 17th. President Trump has said he would add up to 75 million barrels to the reserve, though just last month Congress declined to allocate money in the stimulus bill for Strategic Petroleum Reserve purchases. Alternatively, Trump said he would allow oil not part of the SPR to be stored in the caverns for a price.
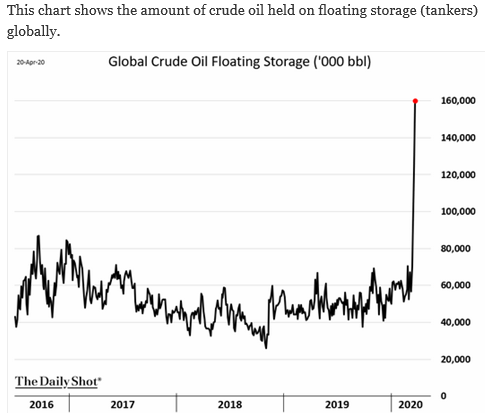
According to the EIA, excluding the Strategic Petroleum Reserve, commercial crude oil inventories have reached 518.6M barrels as of April 17th, 9% above the five-year average at this time of year. Lease rates for very large crude carriers, or VLCCs, have increased rapidly. The average day rate for a 6-month contract is up from $29,000 a year ago to $100,000. One-year contracts are up over the same time period from $30,500 to $72,500. According to Reuters, 160 million barrels of oil are now being stored on ships, reflecting a 60% increase from the previous record of 100 million barrels during the 2009 crisis. Much of this oil is being stored across 60 VLCCs, with capacity to hold more than two million barrels each. For reference, less than 10 VLCCs were being used in February. To manage the remaining capacity, smaller tankers have also been deployed. Figure 3 below shows the drastic increase in floating storage since the beginning of the first quarter.
Figure 3

Source: WSJ Daily Shot , 4/21/2020
Whether Texas will mandate state-wide production cuts is uncertain, given that such action has not been taken since the 1970s. Nonetheless, producers are feeling such intense pressure that they have begun to close the wells themselves. According to the Baker Hughes index, the number of oil and gas rigs drilling in the U.S. has fallen from 813 as of December 20th, 2019 to 465 as of April 24th. This is a significant decline from 1,022 operating rigs as of April 12th, 2019, with levels this low not seen since August of 2016. Some of the biggest producers in Texas, home to the Permian basin and the most shale-rich region in the country, have begun to go offline. The Baker Hughes index shows that operating oil rigs in the region have declined from 414 on December 20th to 246 as of April 24th.
Texland Petroleum LP, in business since 1973, has shut-in all of its 1,211 oil wells and will halt production by May. This follows at least four customers recently canceling purchases, with one customer canceling contracts effective May 1st for 2,000 barrels a day. This accounts for almost 30% of the company’s output. Continental Resources, which drills in Oklahoma and North Dakota, said it would reduce output in April and May by about 30%. Parsley Energy in West Texas has already shut-in about 150 of its older wells, as the company no longer expects them to cover the expense of powering equipment, daily maintenance, and paying out royalties. The choice to shut wells is not an easy one, as there is great uncertainty regarding how wells and future production will be impacted by the closures. Texland Petroleum CEO Wilkes has said that the process is expensive and labor intensive. Workers must treat well casings with chemicals so that they do not corrode once the oil stops flowing. Even if appropriate action is taken, there is no guarantee that a shuttered well can be restarted or reach the same levels of production as before. In addition to onshore production, offshore production accounts for about 15% of U.S. oil output at roughly 2 million barrels of oil per day. These producers have begun shutting off wells in the U.S. Gulf of Mexico, with the move expected to have more negative long-term consequences than cut-offs in onshore plays. This is because while onshore plays, largely shale drilling, are known for shorter time lapses between drilling and first production of oil, offshore producers pay higher prices to produce and transport crude oil to onshore refineries and storage facilities. Given the high premiums this requires, some offshore producers shut off production immediately when prices turned negative last week.
In Conclusion
In 2019, the U.S. produced an average of 12.2 million barrels of crude oil per day, topping previous records, with production in Texas rising from 1.2 million in 2010 to 5.1 million in 2019. Specifically, U.S. production just reached its all-time high of 12.9 million barrels per day in November. In the context of historic domestic production levels reached just months ago, the delayed OPEC+ action, continuing domestic output, and inflows from abroad will likely push storage capacity to its breakpoint. Notwithstanding the OPEC+ production cuts, this time calls for coordination and involvement by countries and business leaders across the world.
Our research is for personal, non-commercial use only. You may not copy, distribute or modify content contained on this Website without prior written authorization from Capital Advisors Group. By viewing this Website and/or downloading its content, you agree to the Terms of Use.
Please click here for disclosure information: Our research is for personal, non-commercial use only. You may not copy, distribute or modify content contained on this Website without prior written authorization from Capital Advisors Group. By viewing this Website and/or downloading its content, you agree to the Terms of Use & Privacy Policy.
