Managing Cash Portfolios in the Tug of War Between Growth and Inflation
Introduction
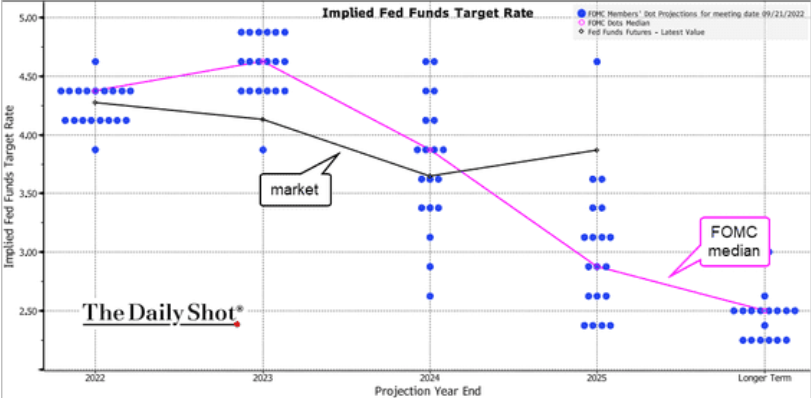
With the 75-basis-point hike in the Fed funds rate on September 21st, Fed officials now peg their median forecast for the key policy rate in the 4.25%-4.50% range by the end of the year. The resulting rise in bond yields has been so breathtaking that the previous expectation that Fed funds would end the year in the 0.75%-1.00% range now seems both distant and farcical. On the day of the Fed action, the yield on the two-year Treasury note surpassed 4% for the first time in 15 years.
Exhibit A: FOMC and Market Projections on Future Fed Funds Rate after the September Meeting
Source: The Daily Shot 9/22/2022.
While cash investors initially welcomed higher yield, rising rates create potential for recent purchases to go under water quickly in market value terms. The message from Fed Chair Jay Powell is clear: the Fed’s job is not done until inflation recedes to near the targeted 2% level, even at the risk of a recession. And therein lies the quandary: should investors stay with very short instruments such as money market funds or overnight deposits with yields that lag the Fed funds rate? Or should they grab higher yields in longer-term securities and risk opportunity costs if future rates exceed current projections?
How should fixed income investors, cash investors included, navigate this rising interest rate environment? Especially when other issues such as supply chain bottlenecks, energy and commodities shortages, a housing slump, and rising labor costs continue to challenge credit performance. With a recession looming on the horizon, we thought it would be a good time for a reality check of current conditions and assess how liquidity portfolios may weather the impending storm.
The Guessing Game on a Fed Pivot
After the July FOMC meeting, the market hoped for a Fed “pivot”—an indication that the Fed was either done with or would moderate the pace of hikes. A slew of official remarks ended that hope quickly, led by Chair Powell’s comments in Jackson Hole on August 26th. The Fed not only delivered a third consecutive 75-bps hike at the September meeting, but also gave no indication that its inflation-taming task is anywhere near done. Instead, its communication on rates was increasingly straightforward, stating their intent to move rates into “restrictive” territory before pausing to ascertain the policy impact. Chair Powell’s position was clear: he is willing to hike rates despite some pains to the economy, including higher unemployment and a possible recession.
After moving rates to a range of 3.00%-3.25%, Fed officials updated their projections for Fed funds to rise 125 bps more in 2022 and 25 bps in 2023 before letting up to drop rates in 2024. Does this mean that the market can interpret the December or the January meeting as the new pivot and start extending long-duration purchases? Perhaps not, as recent history has been unkind to those who traded on the idea of an early Fed change of course.
At the September 2021 meeting, Fed officials projected that the Fed funds rate would end 2022 at 0.25%-0.50%. The rationale back then was that the bulk of Fed tightening would not arrive until 2023-2024, and a possible Fed pivot would come in 2025. For example, someone who relied on the Fed’s projection and bought a two-year Treasury note, then at a 0.25% coupon rate, at $100 would now be staring at a price tag of $96.07 on September 30th – that’s a loss of 3.93% on a “super safe” short-term investment for a year. Coincidently, the one-year return on the ICE BofA 1-3 Year US Treasury Index through September 30th was -4.86%, the largest loss since the Index was created in 1975. In fact, the Index has only had one negative return year, 2021, when it lost 0.555%.
Fast forward to March 2022. Officials at that meeting projected the Fed funds rate would end the year at 1.75%-2.00%. By then, both the Fed and the market had pulled forward expected increases to 2022-2023. Still, a two-year T-note issued at a par value then with a 2.25% coupon rate is now worth $96.95, or a loss of 3.05% in face value. The six-month return on the ICE BofA 1-3 Year US Treasury Index through September 30th is -2.06%.
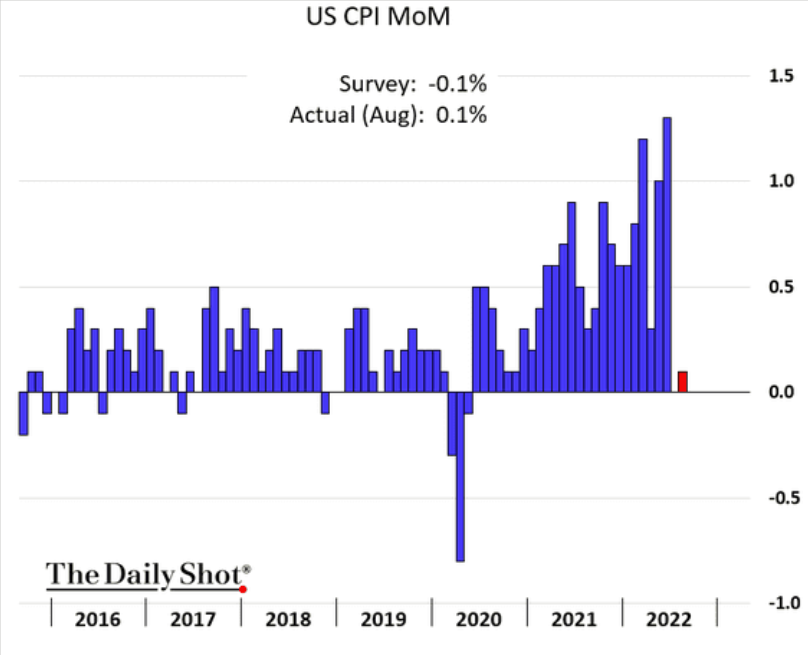
What can we learn from these examples? For one, the Fed, like the rest of us, did not possess a crystal ball. High consumer inflation, originally thought to be transitory or temporary due to Covid-19 restrictions, was exacerbated by the war in Ukraine, China’s zero-Covid policy, and the continuation of the “great resignation” in the American workforce. While the Fed initially sought to balance out its dual mandate of price stability and full employment, core CPI at or above 6% for most of 2022 forced its hand to focus on inflation while letting growth and employment take a back seat. At this stage of the cycle, the Fed cannot afford to be perceived as weak on inflation and prematurely signal a let-up of its tightening bias. Investors vying to trade on an early pivot should think twice about the Fed’s resolve, lest they repeat the same mistakes.
Exhibit B. US Core CPI
Source: The Daily Shot 9/14/22.
Equally important, investors should be prepared for the possible policy mistake of overtightening. Central bankers typically move rates slowly, as they are considered blunt policy tools with effects not shown for several months as they work through the financial system. But to avoid past mistakes of moving too slowly to tame runaway inflation, the Fed could end up moving too aggressively, thus smothering growth. The pace of three to possibly four 75-bps hikes in rapid succession is unmatched in the last quarter of a century. The longer the Fed keeps up this pace, the greater the risk of a deep recession. In that case, the Fed pivot may come abruptly, with rate cuts just as aggressive or more so than the rate increases we’ve seen over the past year. Investors who overlook this possibility may miss out on the opportunity to protect yield in their portfolios when rates are high.
Although our focus has been on the Fed, other central banks such as the Bank of England, European Central Bank, and Bank of Canada are on similarly aggressive paths to higher rates. In August, the Bank of England already announced that its 50-bps hike, the biggest in 27 years, would tip the UK into a prolonged five-quarter recession. And it followed up with another 50-bps hike in September.
Portfolio Strategies
Portfolios entering this rising rate cycle with bonds purchased at near zero yield and months or years away from maturity may have less appetite to add positions. It is especially the case if the Fed is poised to hike some more, thus leading to more unrealized losses. The presumed safe bet is to leave cash in very short maturity instruments, such as government money market funds and Treasury bills, until there are clear signals of a Fed pivot or pause.
Many cash investors have taken this cautious approach which helps explain why money market fund (MMF) assets, after declining from last December’s $4.71 trillion to $4.47 trillion in April 2022, steadily climbed to $4.59 trillion as of September 28th1. Similarly, the Fed’s reverse repo (RRP) facility, where government and prime MMFs account for 80% and 12% of its usage respectively, reached a record balance of $2.425 trillion on September 30th, compared to $1.579 trillion at the beginning of the year2.
The downside to this strategy is the lower yield potential of MMFs and short-dated Treasury bills than the Fed funds rate, or more appropriately, the RRP rate or comparable overnight government repo rates. Since the Federal Reserve limits its counterparties to a few large banks, MMFs, and government sponsored enterprises, many cash investors use government MMFs as an indirect way of accessing the RRP with the catch that they incur a management fee. Others chase after a limited supply of T-bills, which push their yield below the RRP rate. Investors capable of conducting overnight repos with broker-dealers through separately managed accounts (SMAs) may receive rates near or comparable to RRP, although the process of setting up such arrangements may be lengthy and the expertise of managing a repo book may be out of reach for some investors.
Another strategy to consider is to buy bonds with laddered maturities further out on the yield curve. The maturities can range from overnight to, say, 15-18 months, when interest rate policy is expected to approach a neutral stance. Securities with longer tenors may receive progressively diminished allocations. This strategy allows a portfolio to earn yield levels above the RRP with a maturity ladder that allows for reinvestment of proceeds as rates rise. It also provides a partial “lock” of higher rates further up on the curve should the Fed pivot or stop sooner than the market anticipates. This strategy can be especially helpful in a “hard landing” scenario where the Fed reverses course and cuts rates aggressively. Compared to the traditional “barbell” MMF strategy, where portfolios are overweighed at both ends of the maturity spectrum, laddered portfolios tend to produce stable liquidity and minimize market value losses.
Gathering Dark Clouds on Corporate Credit Quality
The aggressive monetary policy actions now underway risk pushing major economies into a deeper than necessary recession to curb inflation. These coordinated rate increases may send unemployment rates up and corporate profits down, leading to higher funding costs and a rising number of bad loans. The culmination of these developments may lead to major credit quality deterioration not seen for over a decade.
These moves are having an immediate effect on the consumer. Credit card debt and car loans are tied to the prime borrowing rate, which increased from 3.25% six months ago to 6.25% after the September FOMC meeting. The Bankrate.com US national average 30-year fixed home mortgage rate spiked to 7.06% on September 30th, more than double the 3.12% rate from a year ago.
Yet the full effect of these and future rate hikes could take months or even years to be felt.
The eurozone is likely already in a recession, based on S&P Global’s August final composite Purchasing Manger’ Index (PIM) of 48.93. The economic pains there are particularly acute due to a nearly tenfold increase in wholesale gas and electricity prices since the start of the war in Ukraine. More recently, the Bank of England declared that the UK economy is in a recession4. A July Bloomberg survey of 34 economists showed the probability of a US recession within 12 months was 47.5%5. The odds are likely to be higher now with 150-bps of rate hikes. A JPMorgan Chase trading model signaled a 92% probability of US recession6 on September 28th.
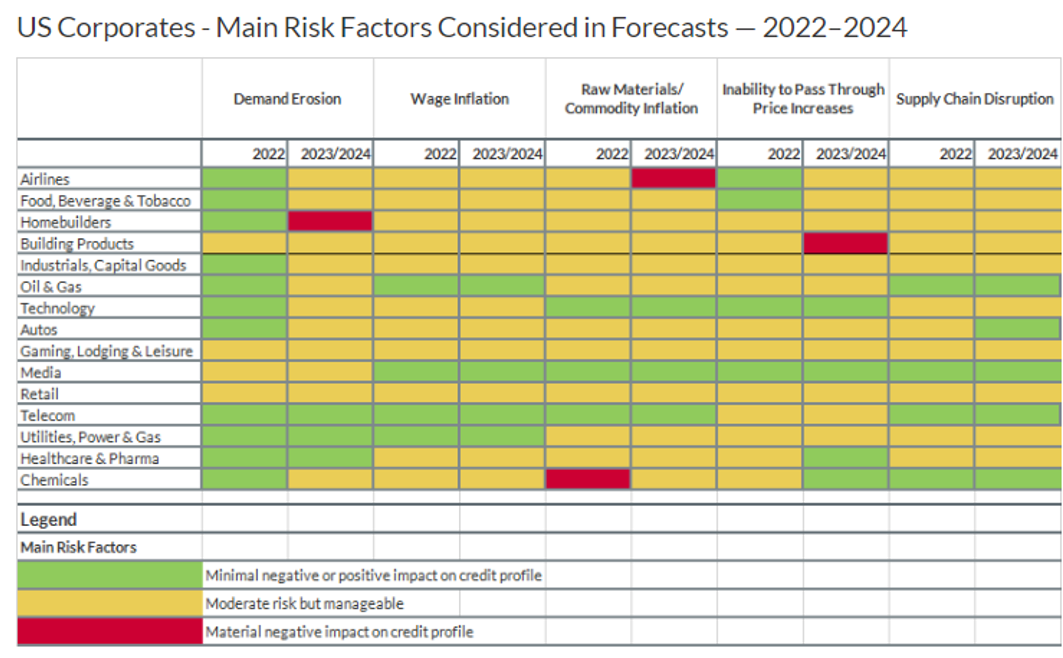
In an August report, bond rating agency Fitch Ratings sounded warnings on US non-financial corporate revenue, profit margins and cash flows7. Sustained high prices for raw materials and commodities, supply chain backlogs, wage inflation, and a failure to pass on costs to consumers will result in varying levels of credit challenges for different industries. Fitch identifies airlines, homebuilders, building products, and chemicals as the industries likely to sustain a “material negative impact” to their credit profiles in the 2023-2024 timeframe. Most of the other 11 industries in its forecast will face moderate but manageable risk.
Exhibit C: Fitch’s Forecast on Growing Risk for US Corporate Industries
Source: Fitch Ratings.
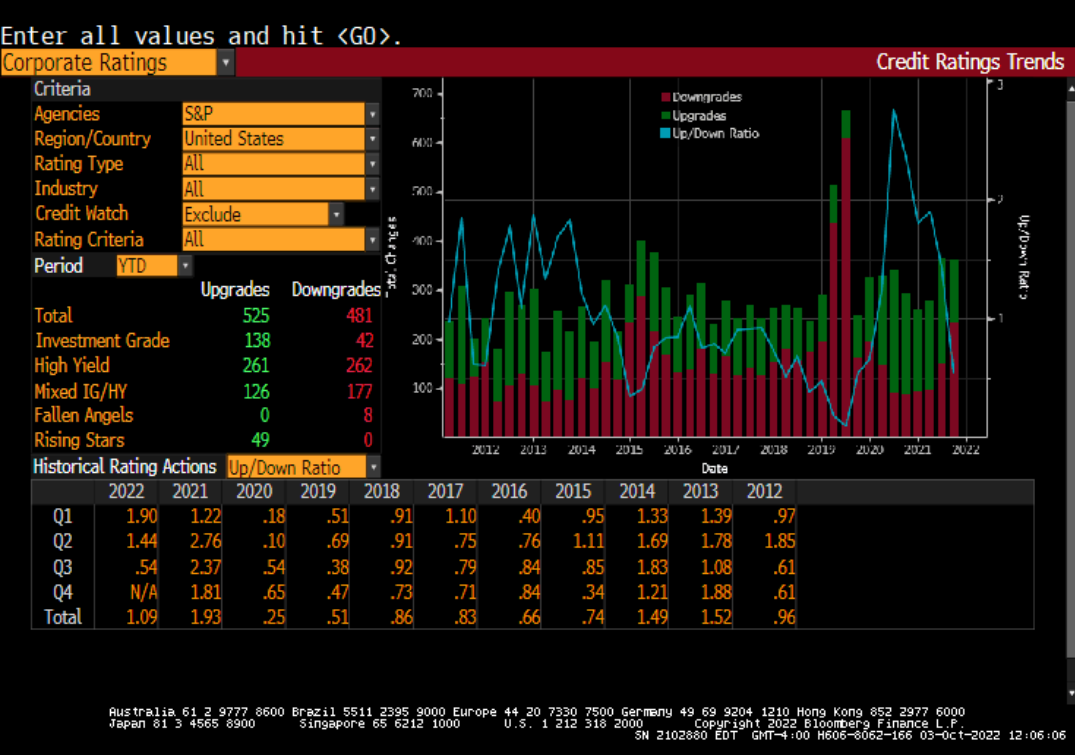
Credit concerns are already showing up in credit ratings. The up/down ratings ratio of corporate debt, tracked by Bloomberg, shows that, although ratings upgrades continue to outpace downgrades, the ratio peaked in the second quarter of 2021 and dropped sharply between the 2nd and 3rd quarters of 2022.
Exhibit D: S&P Corporate Ratings Up/Down Ratio
Source: Bloomberg.
The extremely low-yield environment of the last two years led to strong corporate debt issuance. According to data from the Securities Industry and Financial Markets Association (SIFMA), total US corporate bond issuance rose 60% to $2.27 trillion in 2020 from $1.42 trillion in 2019. The figure then fell back to $1.96 trillion in 2021. The year-to-date issuance through September 12th, 2022, was $1.05 trillion8. As some of the bonds which were issued at historically low yield levels come due in the coming months and years, issuers will be faced with significantly higher funding costs when their profitability will be struck by impending recession and their ability to access liquidity may be met by a more skeptical market.
Portfolio Takeaways
Looming dark clouds on the horizon notwithstanding, high-grade, low-duration credits have held up remarkably well this year. The same cannot be said about lower-quality, longer-term bonds.
The year-to-date total return on the ICE BofA 1-3 Year AAA-A US Corporate Index through September 30th was -4.71%, roughly in line with the -4.35% return in the 1-3 Year US Treasury Index. Although yield spreads of the corporate index widened 44 bps to 78 bps, extra income returns partially compensated for the spread widening. By comparison, the total return on the BBB US Corporate Index in the same 1-3 year maturity range was -6.29% over the same period, significantly worse than either of the first two indices.
A second set of returns compares year-to-date total returns on the general investment bond universe. The AAA-A Corporate index returned -17.51% year-to-date, significantly worse than the comparable US Treasury index return of -13.48%. The return on the lower rated, BBB US Corporate Index was -19.14%.
Exhibit E: ICE BofA Investment Grade Index Returns (Year to Date as of August 2022)
Source: Bloomberg.
One takeaway from the relative performance of the two sets of indices is that a rising-rate environment and possible credit quality deterioration is no reason to shy away from credit investments. Extra yield provided by credit instruments may cushion some of the marked-to-market principal losses. This has been the case with the ICE BofA 1-3 Year AAA-A Rated Corporate Index. For most hold-to-maturity liquidity portfolios, unrealized losses ultimately worked themselves out as bonds matured at par value.
A second takeaway from the table above is that credit quality matters in a rising rate environment. Both sets of data show that the AAA-A Index performed consistently better than the BBB Index, even though both represent investment-grade debt. If the economy is expected to face more obstacles in the months to come, the right strategy today may be to trade up in credit quality by adding instruments that are proven to have weathered economic downturns, while trimming off cyclical and marginal credits.
A third takeaway is that duration matters the most in a rising rate environment. While the short 1-3 Year credit indices experienced low return variances from their Treasury benchmarks, the general bond indices, which include bonds along the entire maturity spectrum, performed significantly worse than the general Treasury benchmarks. When portfolio managers consider adding duration to lock in higher yields, the decision should be made in the context of where the Fed is in the tightening cycle. As noted earlier, a view on the Fed pivot matters both for Treasury and credit investments. A laddered maturity strategy should work with credit instruments as well as Treasury securities in allowing for reinvestment opportunities and limit mark-to-market value fluctuations.
A final word of caution concerns institutional Prime MMFs. These funds were popular with institutional liquidity accounts in previous rising rate cycles as they passed on higher returns to investors relatively quickly and provided attractive yield potential with short-term credit instruments. Investors may be tempted to do the same in this cycle, as the Crane Data money fund universe shows a 20 bps yield differential between the institutional prime and government fund groups as of August 31st. However, the liquidity squeeze in March 2020 exposed the structural vulnerability in prime funds’ weekly liquid assets threshold that could trigger large outflows for fear of “fees and gates.” Industry insiders indicated recently that the Securities and Exchange Commission may finalize its revised ruling on MMF reforms as early as October, and the new rule may include the esoteric requirement of “swing pricing.” While actual implementation will not commence for at least 12 months, prime funds may experience larger-than-usual asset outflows, which may exacerbate NAV fluctuations, an undesirable outcome in a rising rate environment when instruments are often marked down in value from the time of purchase.
1Weekly ICI Money Market Funds Assets, Bloomberg.
2Federal Reserve Bank of New York, Reverse Repo Operations, https://www.newyorkfed.org/markets/desk-operations/reverse-repo#recent-operations.
3Jonathan Cable, Europe heading for recession as cost-of-living crisis deepens, Reuters, September 5, 2022, https://www.reuters.com/markets/europe/europe-heading-recession-cost-living-crisis-deepens-2022-09-05/
4Richard Partington, UK in recession, says Bank of England as it raises interest rates to 2.25%, The Guardian, Economics section, September 22, 2022, https://www.theguardian.com/business/2022/sep/22/bank-of-england-interest-rate-rise-latest.
5Vince Golle and Kyungjin Yoo, Odds of US Recession Within Next Year near 50%, Survey Shows, Bloomberg.com, Markets section, July 15, 2022. www.bloomberg.com/news/articles/2022-07-15/odds-of-us-recession-within-next-year-near-50-survey-shows?sref=ZM113yJm.
6Denista Tsekova, JPMorgan Model Says Stocks in free fall mean recession is a lock, Bloomberg, Markets section, September 28, 2022, https://www.bloomberg.com/news/articles/2022-09-28/jpmorgan-model-says-stocks-in-free-fall-mean-recession-is-a-lock?sref=ZM113yJm.
7Fitch Wire, Demand Erosion a Growing Risk for US Corporate Forecasts, Fitch Ratings, August 23, 2022.
8See SIFMA’s webpage US Corporate Bonds Statistics, https://www.sifma.org/resources/research/us-corporate-bonds-statistics/.
Please click here for disclosure information: Our research is for personal, non-commercial use only. You may not copy, distribute or modify content contained on this Website without prior written authorization from Capital Advisors Group. By viewing this Website and/or downloading its content, you agree to the Terms of Use & Privacy Policy.

