Inflation: Signal vs. the Noise
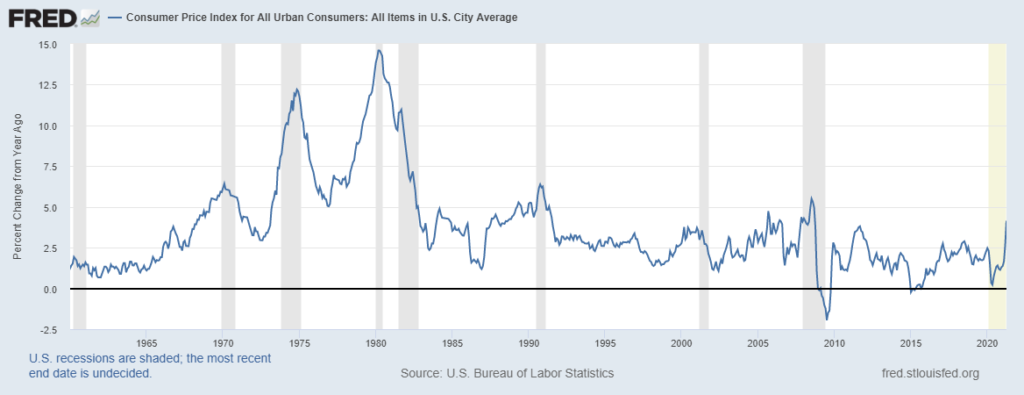
Inflation, it’s all the rage in financial market commentary of late. After being dormant for the better part of a decade, the CPI came roaring back to life in April, with the headline index posting a 4.2% year-over-year rise and the core index posting a 3% increase. This has resulted in a lot of talk about the possibility of reflation, especially in the context of the massive wave of government stimulus, supply bottlenecks, and economic re-openings. But considering that this is just one report, how much information can we truly derive from it? It is hard to know for sure, but there are several obvious reasons to take the current numbers with a grain of salt.
1. Base Effects
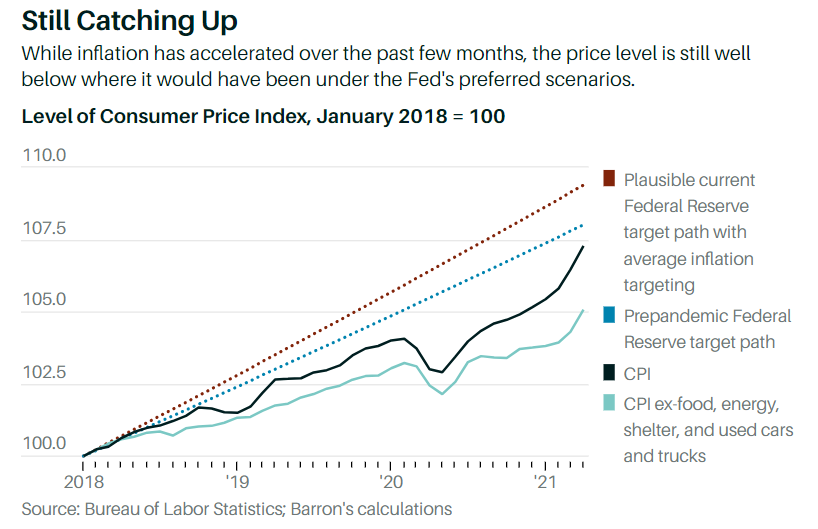
The biggest caveat with year-over-year comparisons are base effects. All this means is that if the initial month of comparison is unusually high or low, it can cause the year-over-year growth rate to diverge from the underlying trend. For this past April’s report, the base month was April 2020, a month when prices fell by 0.7% as the economy entered lockdown. Compared to that low level, the measured increase in prices looks high. However, as Matt Klein notes, it really just represents inflation returning to trend.

It is expected that base effects will be in play for the next few months, resulting in unusually high year-over-year readings. However, these effects will fade once we get past the summer, when year-over-year comparisons will once more become commensurate with the underlying trend of the price level.
2. Re-Opening Impact
While base effects can account for the elevated year-over-year inflation reading, they cannot explain the high level of month-over-month inflation. The headline CPI rose by 0.8% from March to April, a 10% annualized rate.
Much of this increase was linked to idiosyncratic factors tied to the re-opening of the economy. For instance, the red-hot used car market accounted for 33% of the rise in the CPI, even though the segment constitutes just 2.75% of the index. The jump reflects excess demand for used cars from rental companies, who are in a rush to restock their inventories after drawing them down earlier in the pandemic. Furthermore, airline prices jumped by 13% as air travel started ramping up again.
There are two sides of the coin here. On the one hand, this is just one month of data, and these specific sectors are not likely to see such large price increases in subsequent months. On the other hand, this illustrates how near-term inflation may be pressured by a shift in spending towards services that are just coming back online. Over the longer run these impacts will fade, but for the coming months they may result in further headline-grabbing inflation readings.
3. Supply Chain Pressures
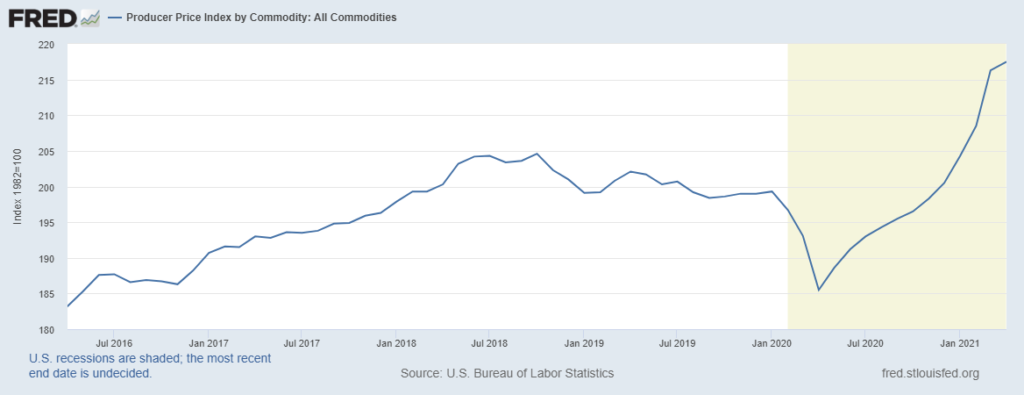
The third factor impacting near-term inflation is supply chain pressures resulting from a shortage of a variety of primary and intermediate goods. These shortages range from lumber to semiconductors and can be seen clearly in the Producer Price Index (PPI), which has shot up in the last 6-months.

However, the PPI is not necessarily a determinant of the CPI for several reasons. First, firms may be price takers in their industries, and thereby choose to absorb the higher costs rather than risk losing market share by raising prices. Second, supply pressures tend to clear over time. Production eventually increases and supply meets demand, unplugging bottlenecks and easing the upward price trend. There is some evidence that this is starting to happen in commodities markets, as the prices of oil and lumber have started to come back down the past two weeks. Assuming price reductions continue, the impact of supply chain pressures on inflation should diminish over time.
Longer-Run
Although the specific factors impacting April’s inflation report are unlikely to last, there is some reason to suspect that we may see a shift from the continual disinflation experienced since the Great Financial Crisis. It’s important to note that this does not mean the economy is about to go through a reboot of the 1970s, when inflation averaged 7% and regularly crossed the 10% threshold. Following that episode, the Fed committed to conquering inflation and has now built-up 35+ years of credibility as an inflation manager.

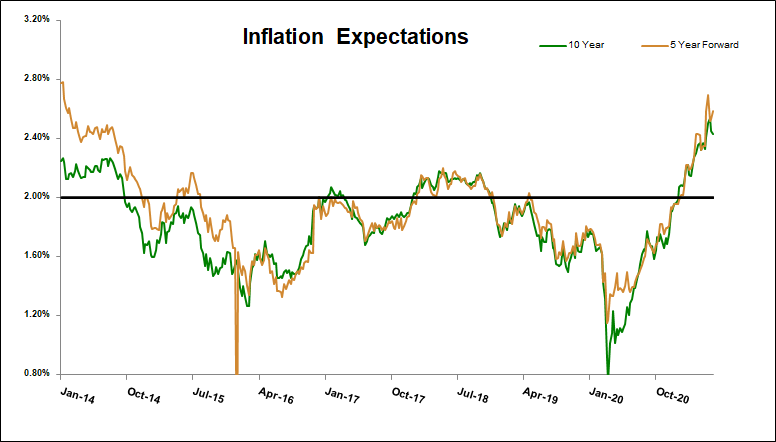
Furthermore, inflation expectations over the next five and ten years remain well-anchored at levels that are consistent with a 2% inflation target. So there’s nothing to suggest that we’re about to see a sustained spike in the price level.

Nevertheless, expectations are in line with the view that inflation will be somewhat higher in the coming decade than it has been in the last decade. This is consistent with the Fed’s new average inflation targeting framework, in which it aims to achieve periods of inflation above its 2% target to compensate for periods where inflation is below 2%. It stands to reason that if the Fed is now more tolerant of higher inflation (say in the 2-3% range), then higher inflation will in fact manifest. This is especially true in the context of pent-up consumer demand following lockdowns, excess levels of household savings, expansionary fiscal policy, and a potential shortage of labor in some parts of the country. It’s quite possible that these could be the catalysts for a period of higher inflation, which the Fed accommodates rather than attempts to offset.
Should this happen, the expectation would be that interest rates would rise, resulting in a sell-off in bond markets and a potential widening of spreads. While this would result in some short-term pain for fixed income investors, it may be beneficial in the long run if yields are able to sustain themselves at levels above those seen post-financial crisis. Furthermore, with interest rates at higher levels, the Fed would have more scope to pursue expansionary monetary policy in the event of a downturn, and cash investors would spend less time dealing with the dreaded zero-lower bound. But of course, as with everything, the proof will be in the pudding. Investors won’t know how big the change will be until it actually comes about.
Please click here for disclosure information: Our research is for personal, non-commercial use only. You may not copy, distribute or modify content contained on this Website without prior written authorization from Capital Advisors Group. By viewing this Website and/or downloading its content, you agree to the Terms of Use & Privacy Policy.
