
Corporate Leverage: Par for the Course or Harbinger of an Upcoming Crisis?
Abstract
As the post-recession credit cycle matures and a period of historically low interest rates ends, investors are paying increased attention to the rise of corporate leverage. Companies have borrowed heavily in the past decade to fund M&A activity and investor payouts. This has resulted in significant growth in BBB-rated debt for investment-grade (IG) issuers as well as higher activity in the leveraged debt space. In the context of tighter monetary policy, we review potential risks to the outlook arising from the current state of credit markets and their potential impact on institutional cash investment portfolios in the event of a downturn.
Introduction
In our recent, two-part whitepaper, Shifting Dynamics of a Maturing Expansion, we identified high corporate leverage and growth in BBB-rated debt outstanding as the predominate current risks for domestic credit markets. In this paper, we take a deeper dive into the specifics and we attempt to gauge the extent to which IG portfolios could be at risk.
In the first section, we identify three primary risk factors for IG investors. First, we look at the likelihood and consequences of large issuer downgrades from investment grade to speculative grade (SG). This we term “Fallen Angel” risk. Second, we examine likely sources of indirect risk via exposure to banks and non-bank financial institutions that have direct exposures to the growing leveraged debt sector. And third, we gauge the sensitivity of the outlook to investor sentiment, identifying factors that could result in sentiment-driven shocks to liquidity.
In the following section, we place those risk factors into the context of current market conditions. We examine the strength of corporate business profiles, ratings momentum, and the impact of post-crisis regulations on the resilience of the financial system as mitigating factors.
We conclude by outlining some best practices for today’s institutional cash investors to help safeguard portfolio performance.
How Did We Get Here?
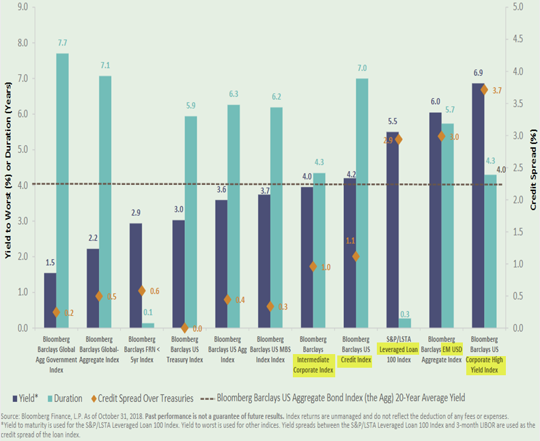
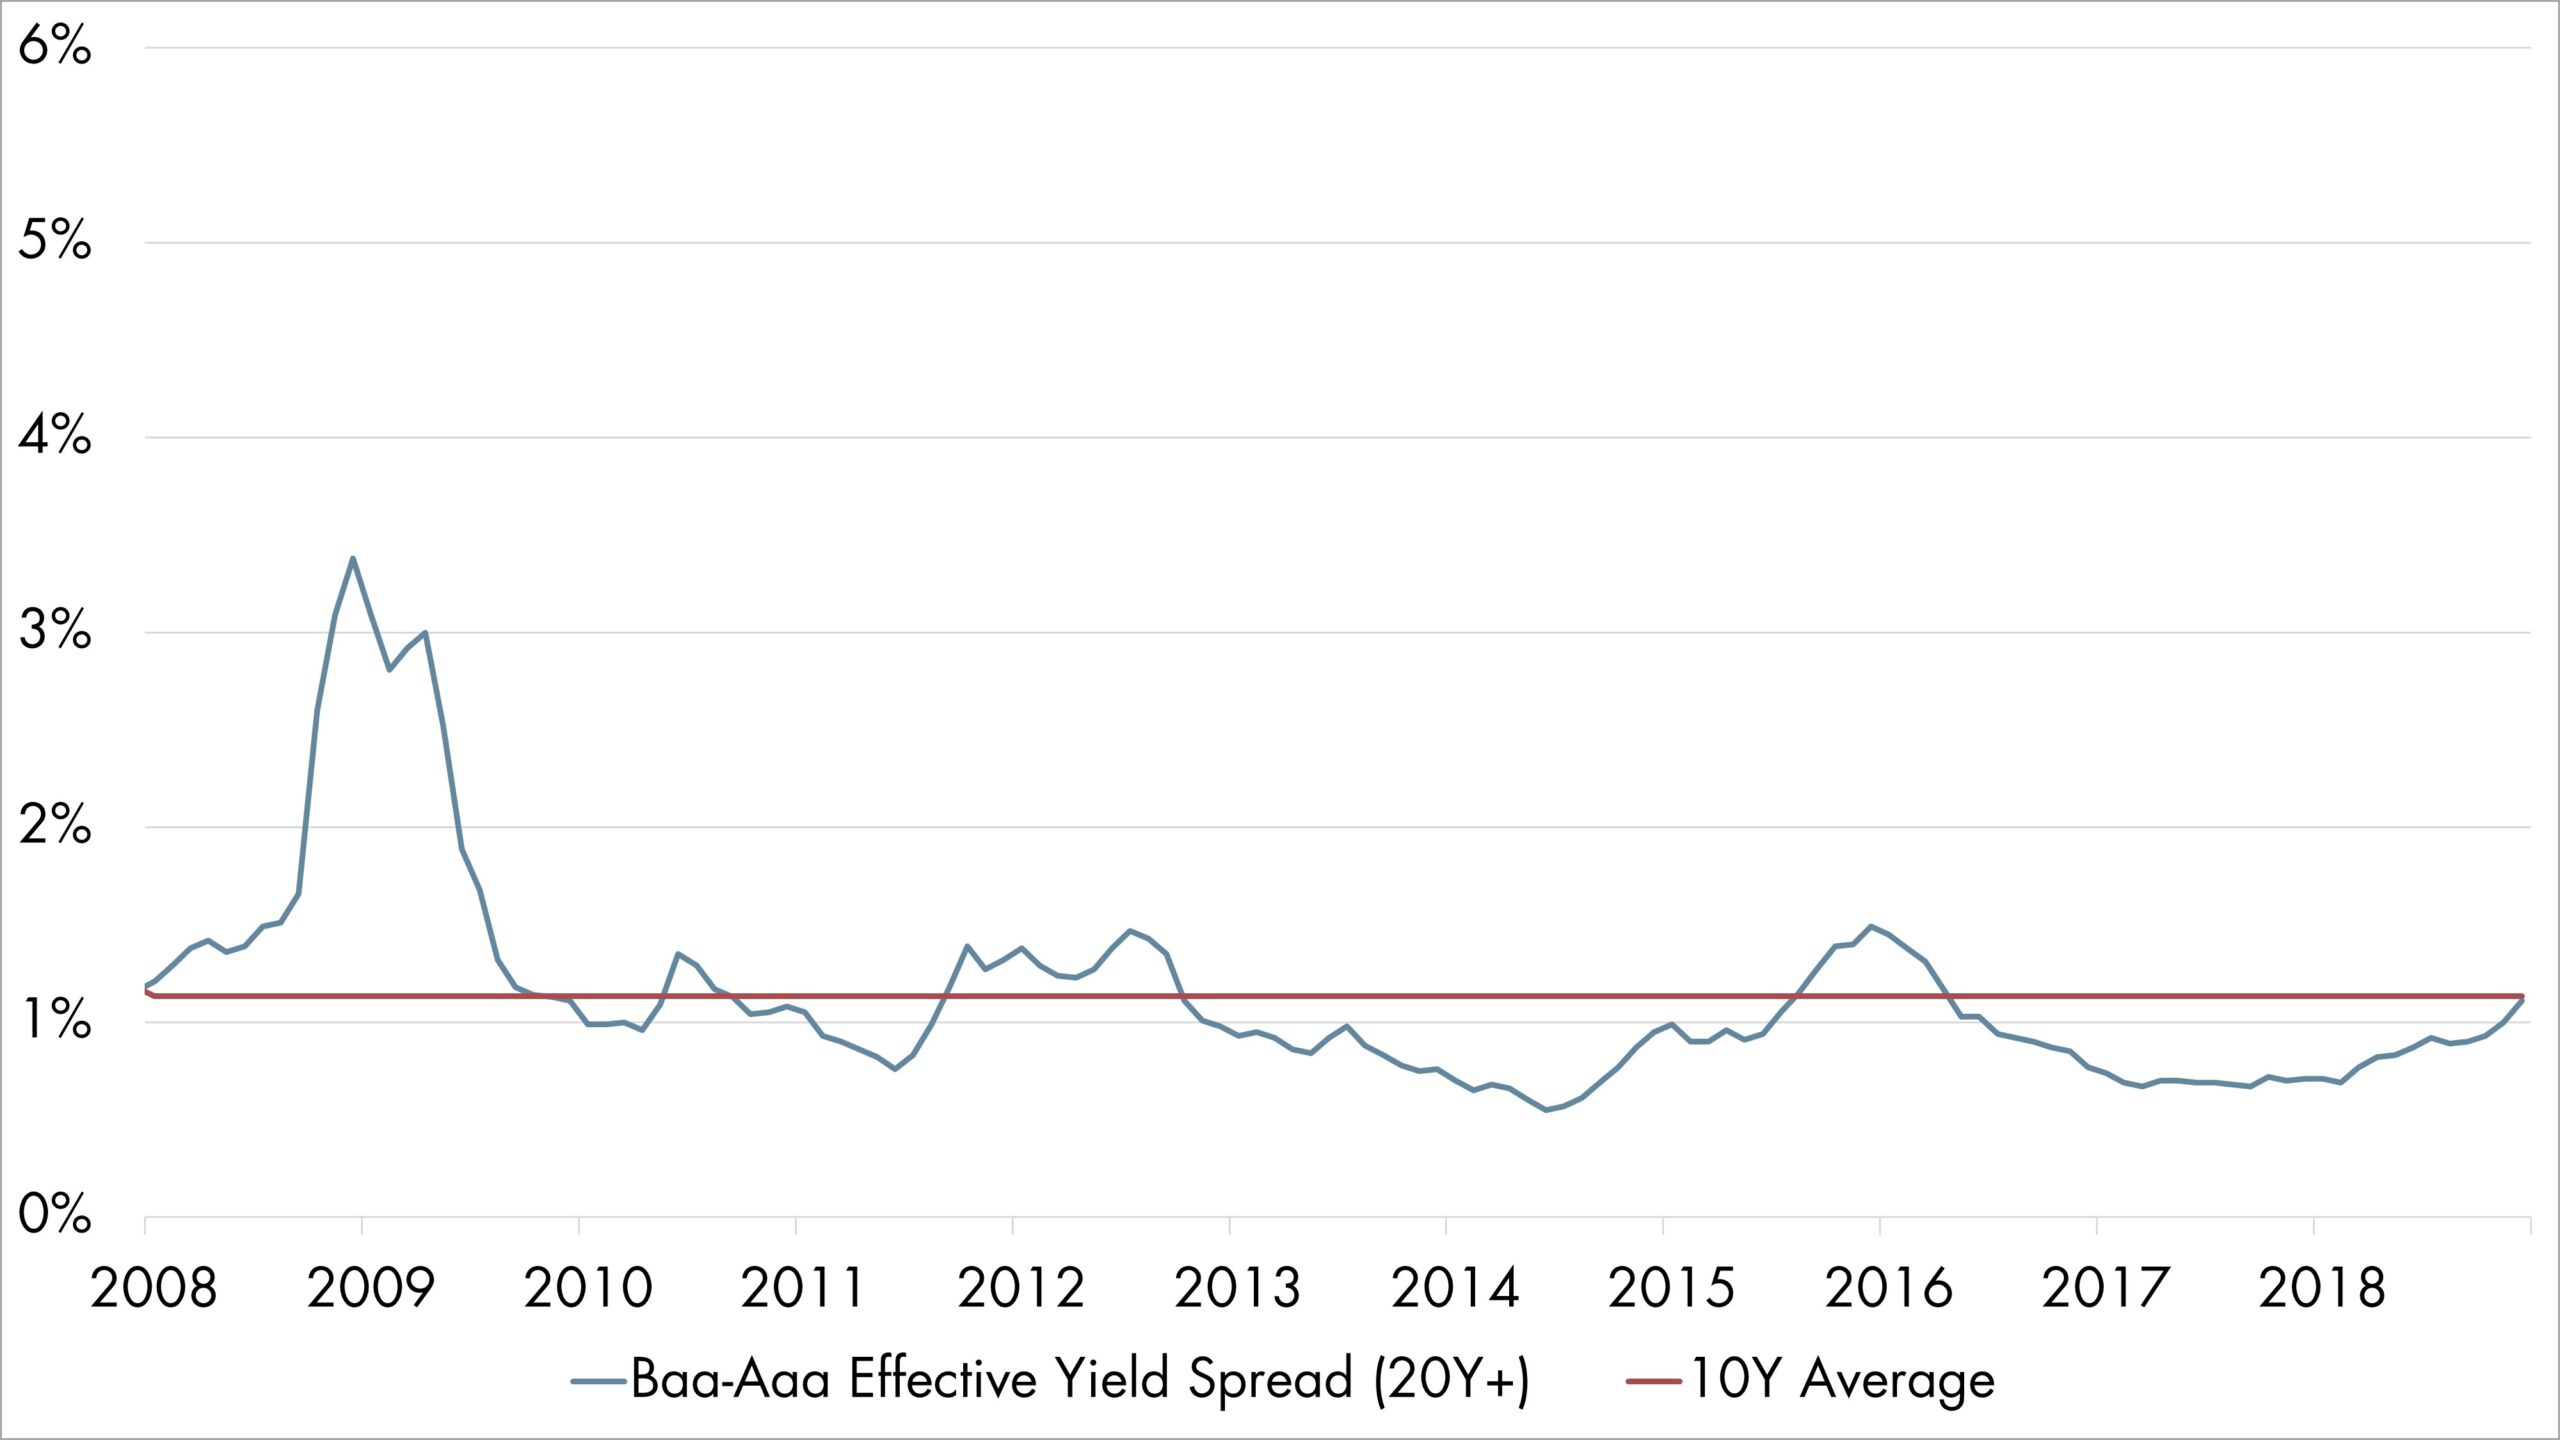
Over the past decade, the confluence of quantitative easing and low benchmark rates supported the second longest expansion in US history. Benign credit conditions, spanning the better part of the decade, limited options for yield-seeking investors as traditional bond investments yielded less than their historical averages (Figure 1). This has fostered greater risk tolerance and kept a lid on credit spreads as funds flowed toward riskier debt (Figure 2).
Figure 1: Bond Market Segment Yield, Duration and Spreads
Source: WSJ The Daily Shot, Bloomberg LP
Figure 2: Baa-Aaa Effective Yield Spread (20Y+)
Source: FRED, Federal Reserve Bank of St. Louis
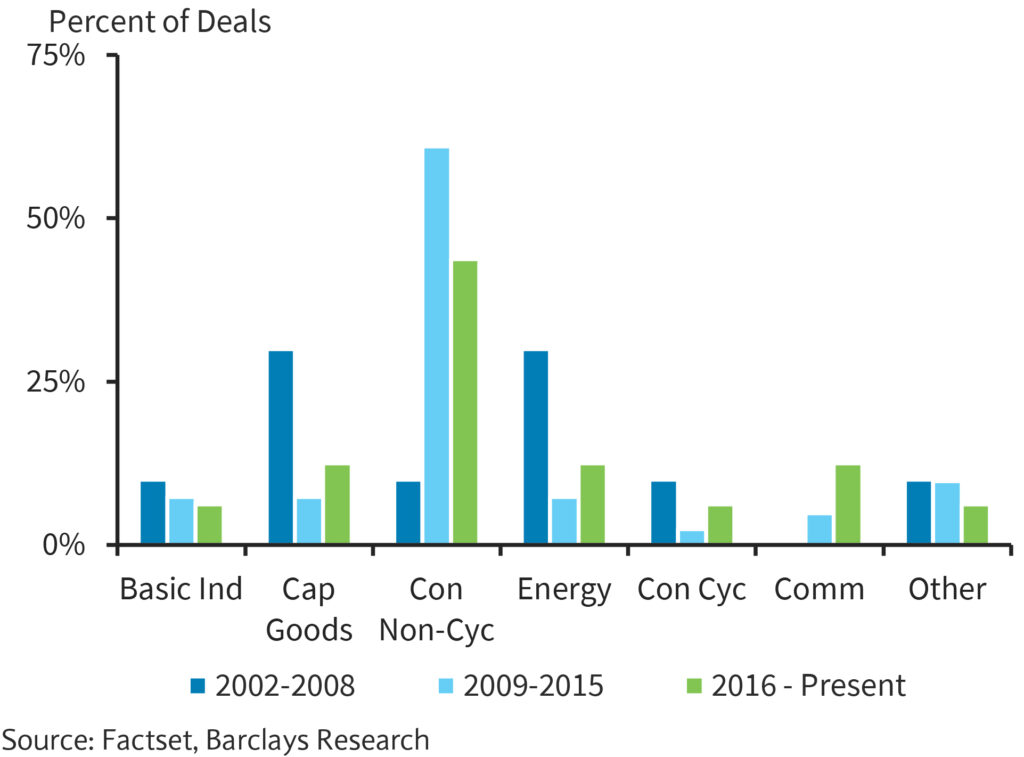
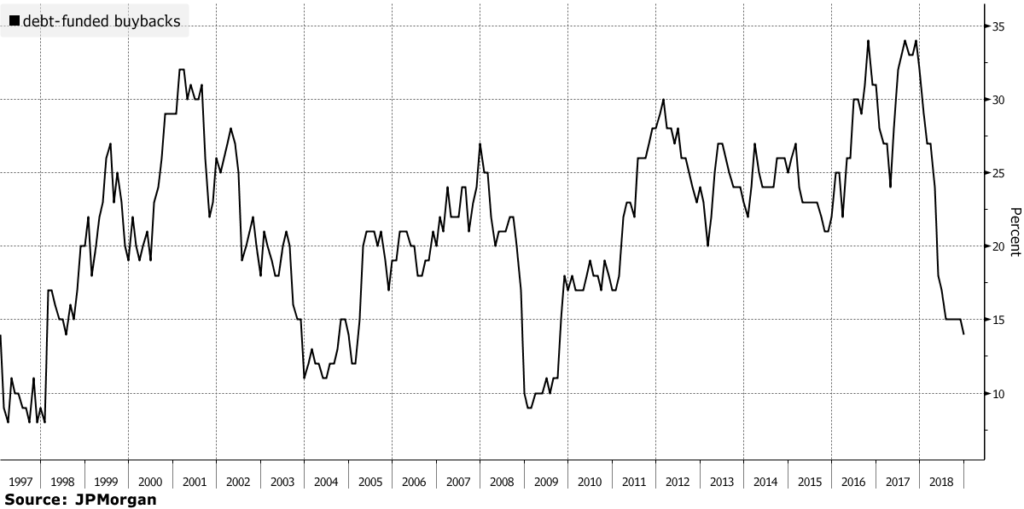
The corporate sector took advantage of cheap credit, increasing M&A activity in search of synergies and greater market share. Indeed, the number of “mega-deals” grew substantially in the past decade compared to pre-recession years (Figure 3). Additionally, debt-financed investor payouts also saw an increase over the last few years, peaking in 2017 (Figure 4).
Figure 3: Historical Large M&A Transactions by Sector
Source: Factset, Barclay’s Research (January 17, 2019)
Figure 4: Shift in Funding: Debt-Financed Buybacks Fall to 14%, The Lowest Since 2009
Source: JP Morgan, Bloomberg, Debt-Financed Share Buybacks Dwindle to Lowest Level Since 2009
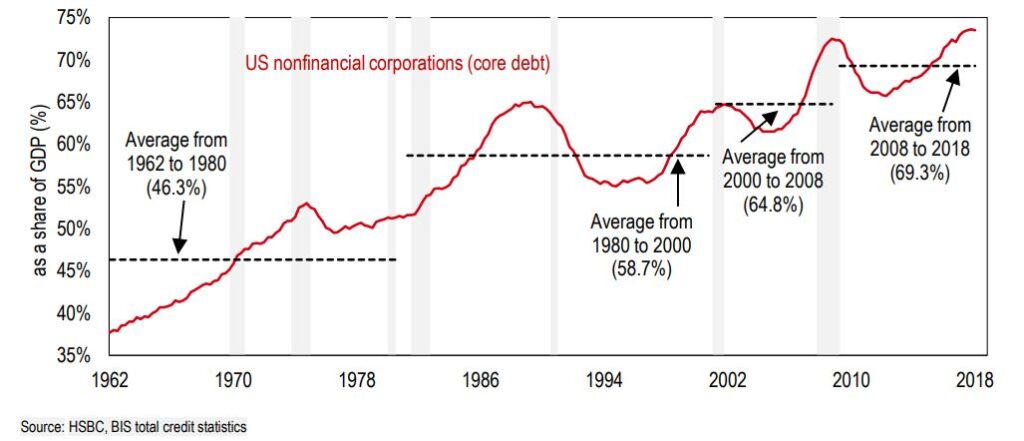
The combined cumulative impact of these actions was an increase in corporate debt outstanding, raising the debt-to-GDP ratio to an all-time high, and exceeding the 2008-2018 average (Figure 5).
Figure 5: U.S. NonFinancial Corporate Debt as Share of GDP
Source: HSBC, MarketWatch, These 5 charts warn that the U.S. corporate debt party is getting out of hand
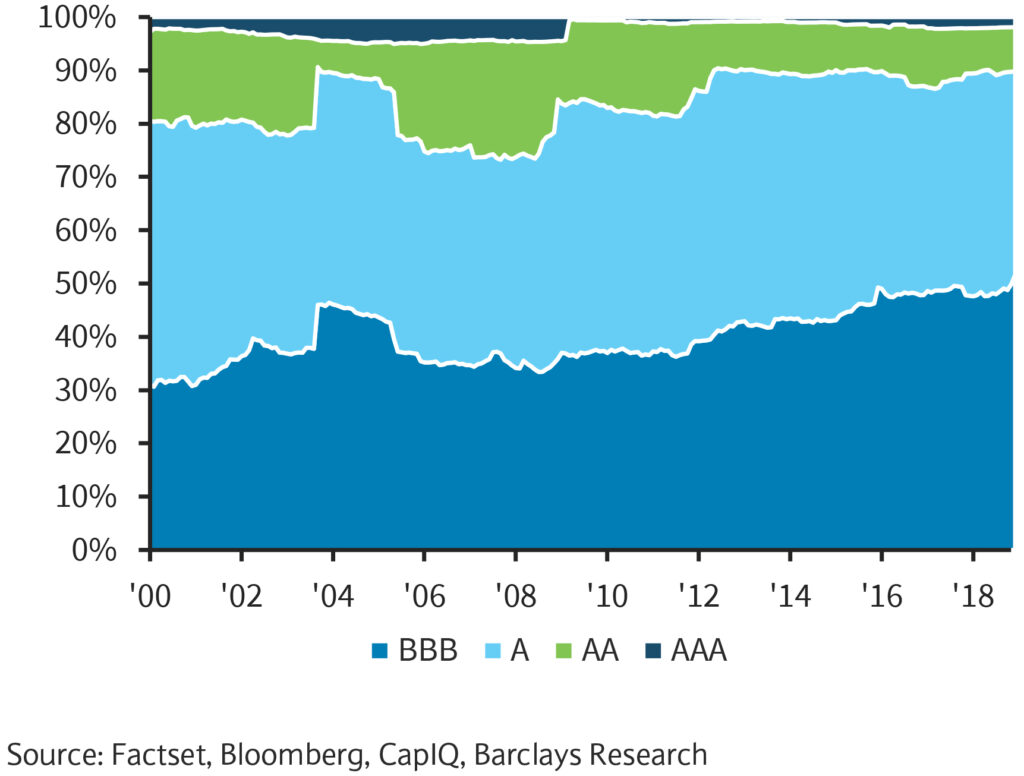
This increase in corporate leverage can, in itself, be seen as a cautionary signal regarding the sustainability of the current expansion. Recent research1 has suggested that rapid build-ups in leverage, in combination with more lower quality issuance, may serve as a reliable leading indicator of impending downturns over the medium-term. In this context, what has captured investors’ attention is the fact that most of the growth in leverage has been through BBB-rated debt issuance. Figure 6 shows that the volume of BBB-rated debt has nearly tripled over the past decade. Figure 7 also shows the increasing portion of the investment grade space that is now comprised of BBB-rated debt.
Figure 6: Rated Debt of Baa Nonfinancial Companies Has Almost Tripled Since 2007

Source: Moody’s Investor Service
Figure 7: BBBs Continue to Represent a Larger Portion of the Investment Grade Index
Source: Factset, Bloomberg, CapitalIQ, Barclays Research
There are a couple of likely explanations for this increase. First and foremost, as previously noted, spread tightening between rating tiers has brought down the cost of carrying lower ratings, enabling companies in the A and AA rating tiers to adopt more aggressive financial strategies without the downside of significantly higher cost of debt. Second, strong earnings growth over the past few years may have lent confidence to management teams that any venture into the lower tiers of investment grade credit will only be temporary. Lastly, revenue moderation in a maturing business cycle may have created a stronger imperative for exploring inorganic growth options.
Risk Factors Affecting the Outlook
Recent economic and geopolitical developments, coupled with the ongoing monetary policy normalization, have begun to visibly influence economic performance and market sentiment. The market gyrations seen in December of 2018 and the broader resurgence of market volatility point to a re-evaluation of risk tolerance by market participants, along with some worries over the trajectory of the US economy in the medium-term. While high leverage alone does not necessarily lead to trouble, it may reduce the resilience of levered firms to adverse shocks. In light of that, we have identified three main risks to the outlook:
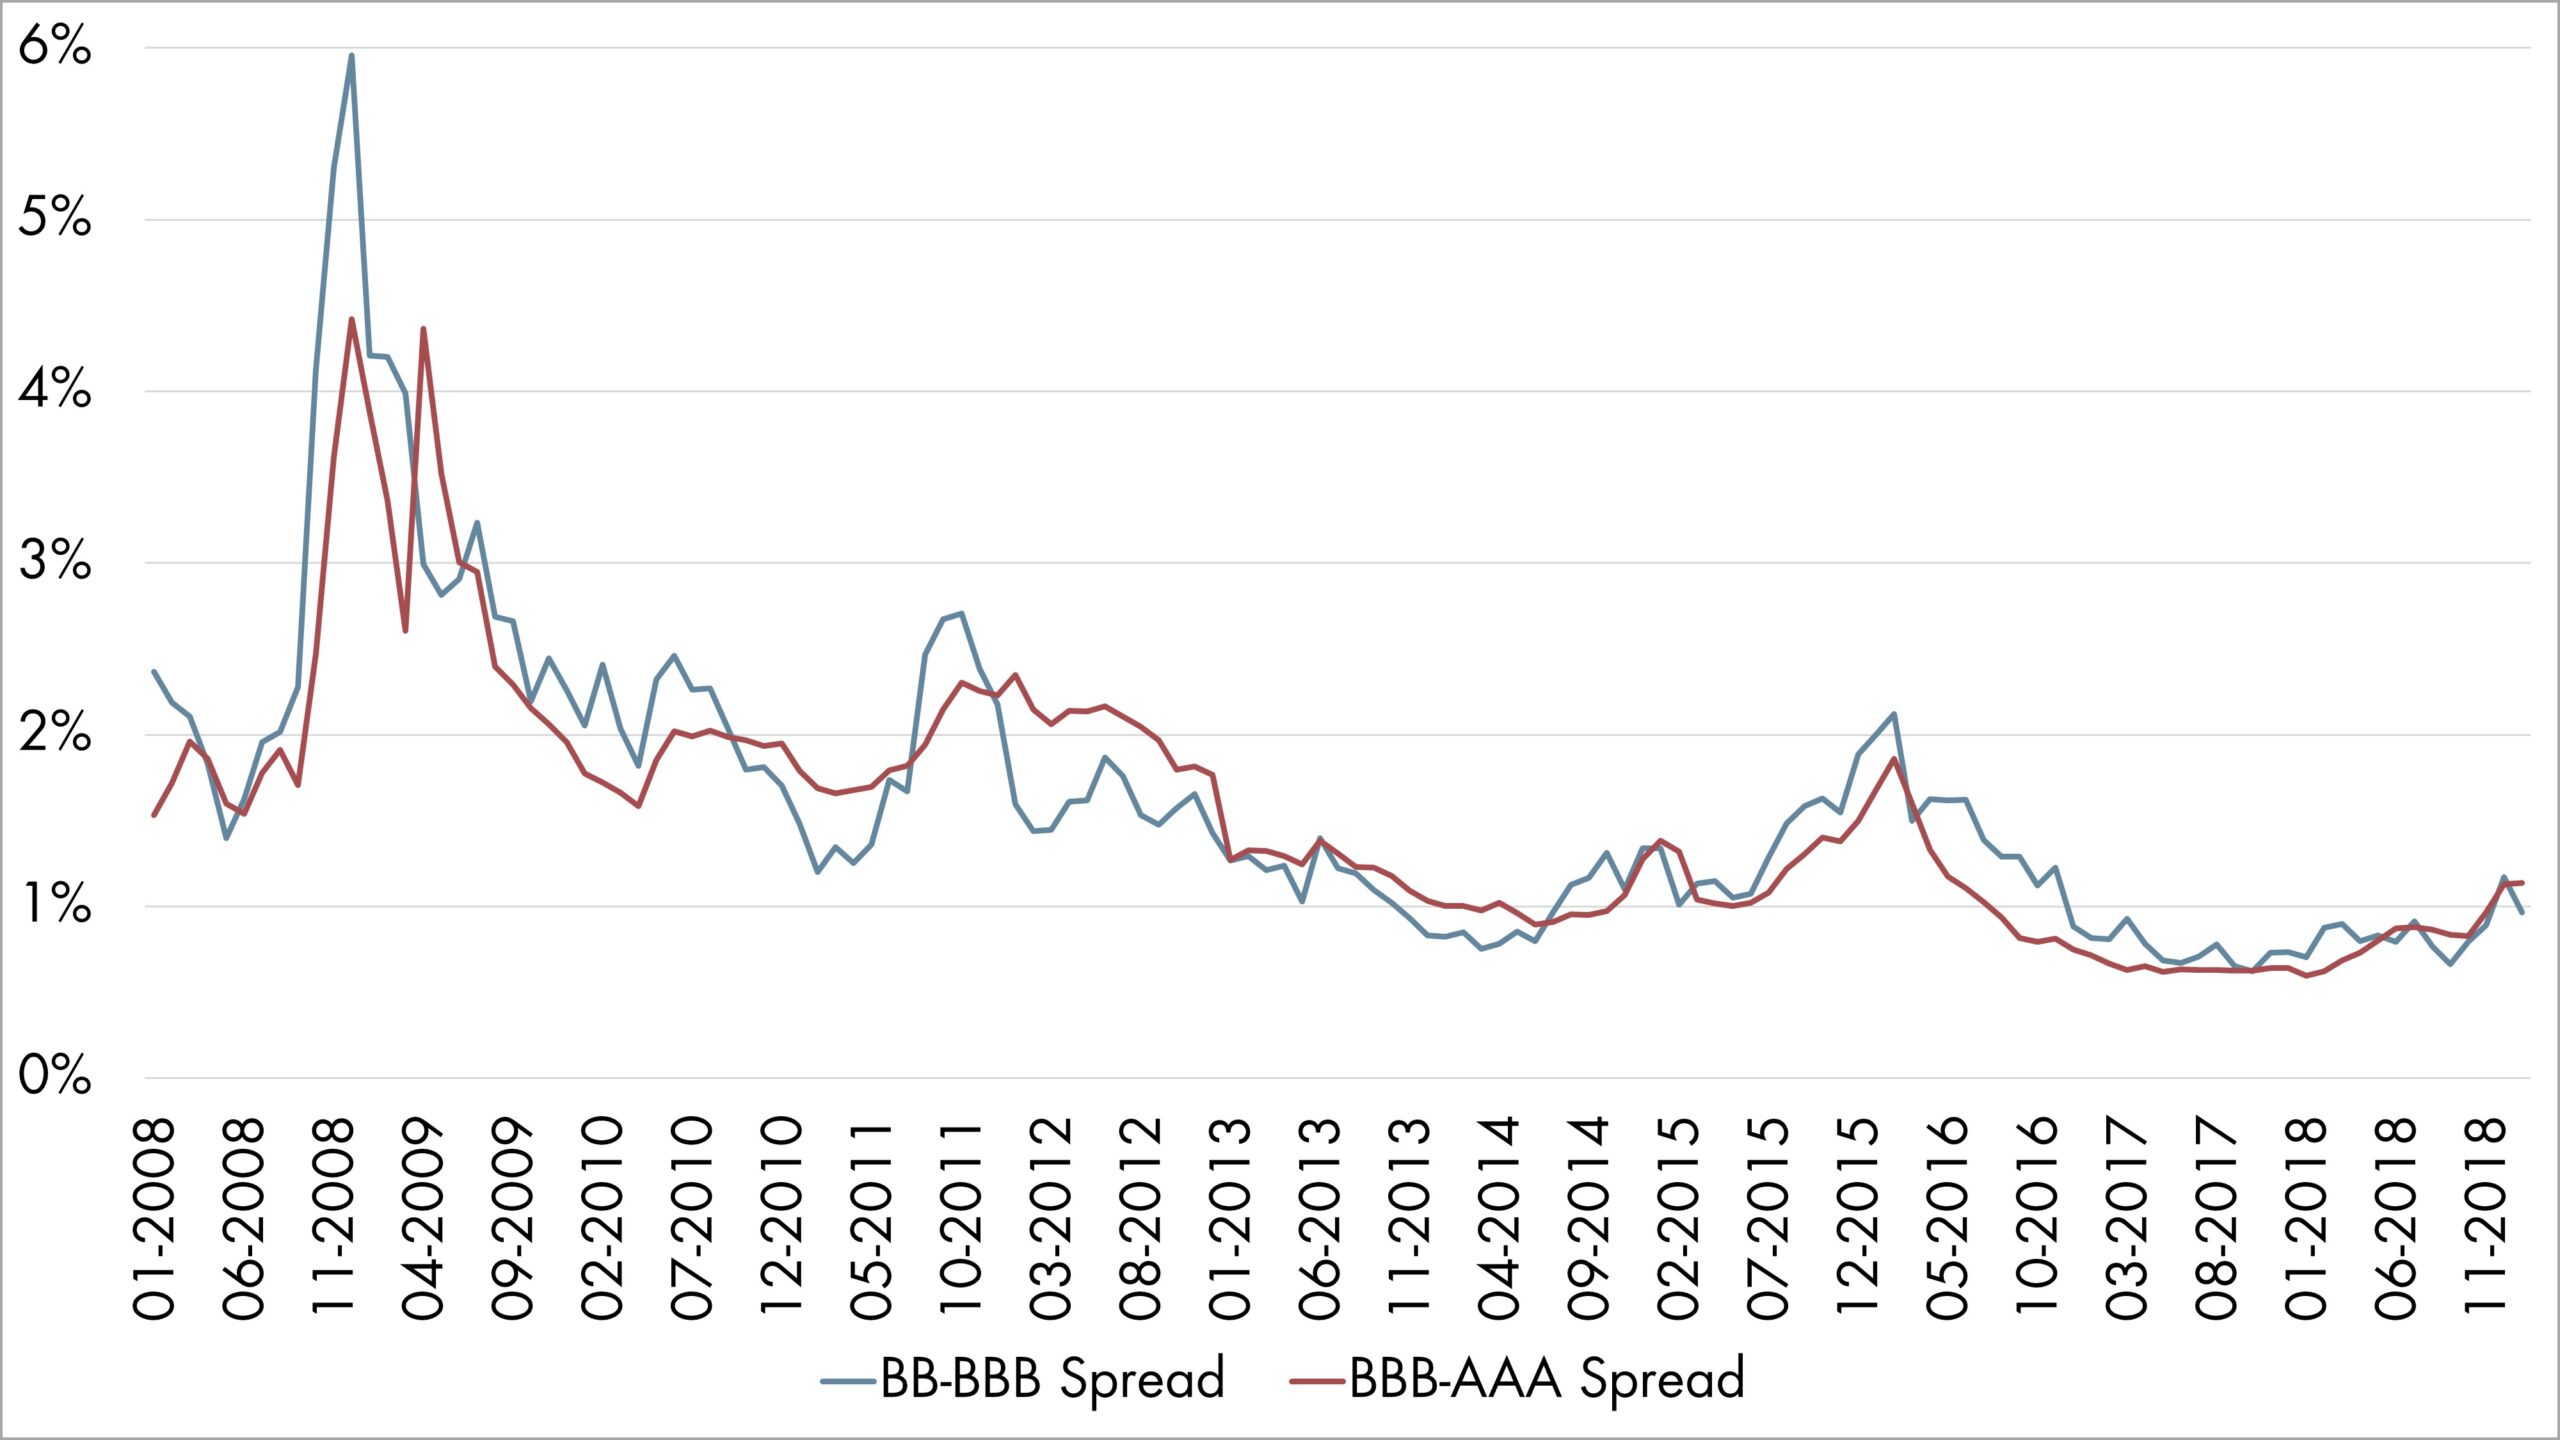
Fallen Angel Risk: The primary concern with a buildup of BBB-rated debt is the risk of an issuer losing its investment grade status. Such a move could result in material investor losses, as spreads between BBB and BB debt (1-3 notch difference) have on average exceeded the spread between AAA and BBB rated debt (7-9 notches difference) (Figure 8) by 8 basis points over the past 10 years.
Figure 8: IG to SG Spread Comparison
Source: FRED, Federal Reserve Bank of St. Louis
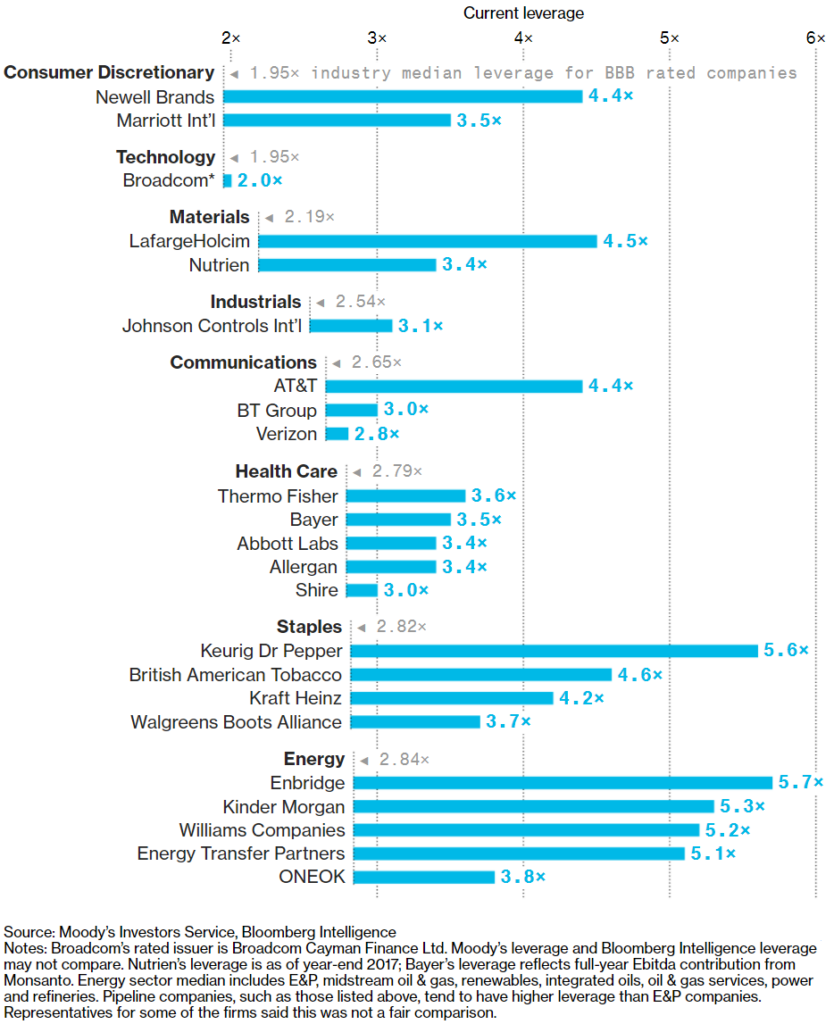
As with previous recessions, the primary driver of credit conditions will be the state of corporate balance sheets when the business cycle turns. This time, however, there may be some aggravating factors at work. Some market watchers2 have suggested that perhaps rating agencies have been too lenient with levered firms, relying too heavily on management deleveraging plans rather than on current fundamentals. This can introduce excess ratings sensitivity to the business cycle, as a cyclical decrease in revenues could squeeze EBITDA margins, materially worsening debt service and leverage metrics and possibly leading to widespread ratings adjustments. For highly levered companies, a downgrade to junk status poses the risk of having to refinance debt at higher rates at the same time that the economy is in a downturn. Figure 9 shows that in several industries, leverage metrics have exceeded, sometimes materially, their industry median for BBB-rated companies. While leniency from rating agencies is supportive of business profiles, it also raises the risk of complacency by management teams in their pace of deleveraging.
Figure 9: Levered Up
Source: Moody’s Investors Service, Bloomberg Intelligence
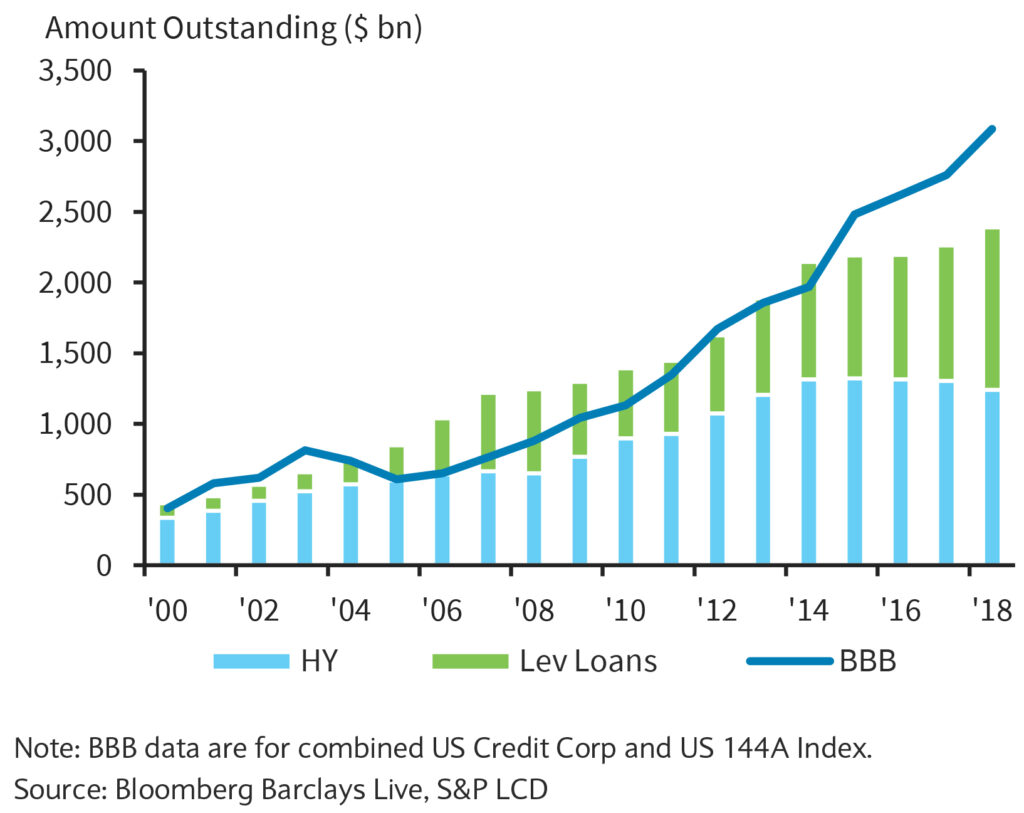
A separate worry is that BBB-rated debt outstanding is rather concentrated by issuer. The largest 10% of issuers rated BBB account for over 20% of all BBB-rated debt, while the largest 5% account for nearly 15% of all BBB-rated debt (Figure 10). This is significant because an IG issuer downgrade into speculative grade could result in a substantial volume of IG debt moving into speculative grade as well. BBB-rated debt has surpassed in volume the combined amount of high-yield debt and leveraged loans outstanding (Figure 11).
Figure 10: The Concentration Among the Largest BBB Issuers in Line with Long-Term Averages

Source: Barclays Research
Figure 11: BBB and SG Debt Outstanding
Source: Bloomberg, Barclays Live, S&P LCD
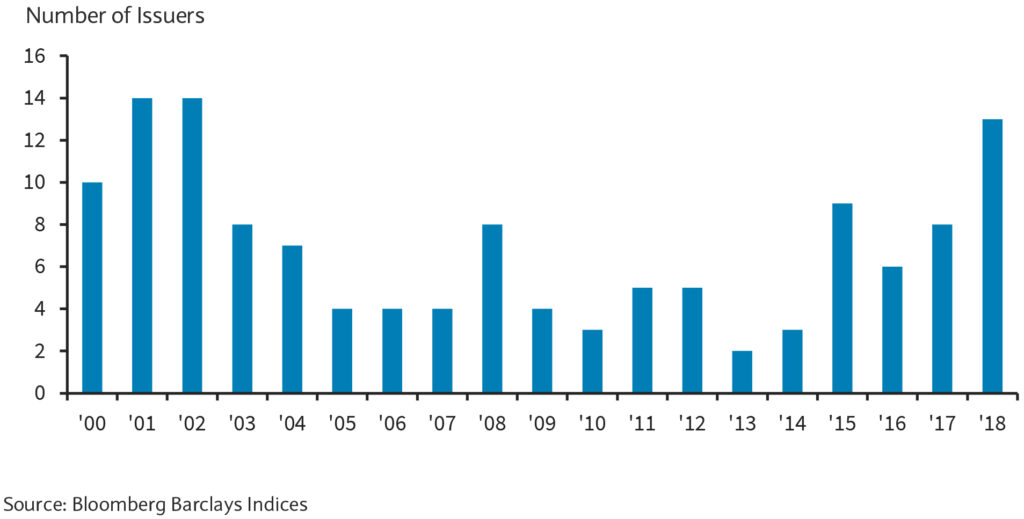
Such a large migration of debt into speculative territory could seriously disrupt funding for existing SG issuers. As can be seen in Figure 12, Barclays quantified that debt migration at 2% of the par value of S&P’s U.S. High Yield Corporate Bond Index. This index is a preferred benchmark for a number of high-yield mutual funds, with ETFs alone representing a combined 19%-22% of the high-yield market buyer base3. A downgrade of a firm large enough to breach this 2% threshold could result in the dislocation of high-yield borrowers out of the index, leading to widespread selling of affected debt, a liquidity crunch and potential temporary restriction of affected issuers’ access to high-yield credit markets. The likely impact of such an event on investor risk sentiment, especially if combined with broad market stress, could indirectly impact the investment grade universe through spread widening. In the context of highly levered IG issuers, this could lead to tighter liquidity and possibly value erosion for exposed investors.
Figure 12: Number of BBB Industrial Issuers with Market Value Greater than 2% of US High
Source: Bloomberg Barclays Indices
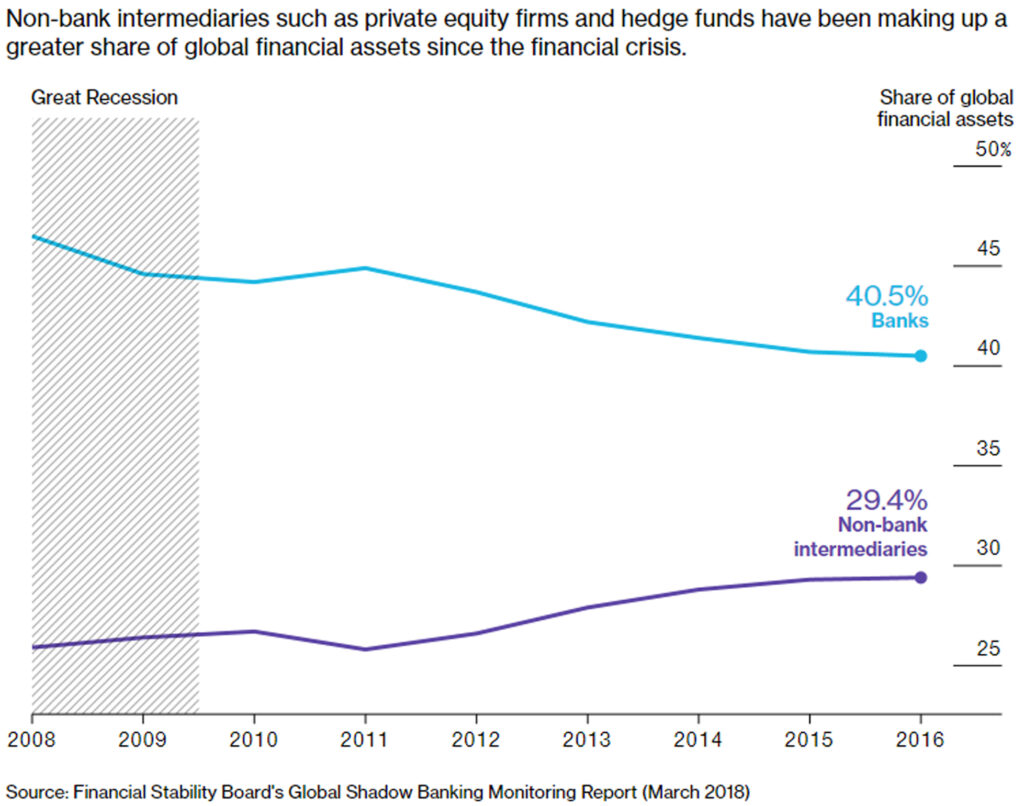
Contagion Risk: An indirect, but possibly consequential, risk exposure could come from the financial sector. In recent years, leveraged debt has grown in popularity as a means of boosting portfolio returns, with investor demand compressing borrowing costs and encouraging further issuance. Leveraged debt assets include mainly speculative grade bonds and direct loans to firms with levered balance sheets. Leveraged loans specifically have become the preferred investor instrument as of late, since their floating rate structure and book-value accounting support value stability in a rising rate environment. This has led to significant growth in issuance over the past few years, with more levered firms gaining access to funds and non-bank financial institutions stepping in to soak up demand for funds which fall outside the purview of traditional banks (Figure 13). Consequently, a significant part of an increasingly important funding market has moved to less regulated players.
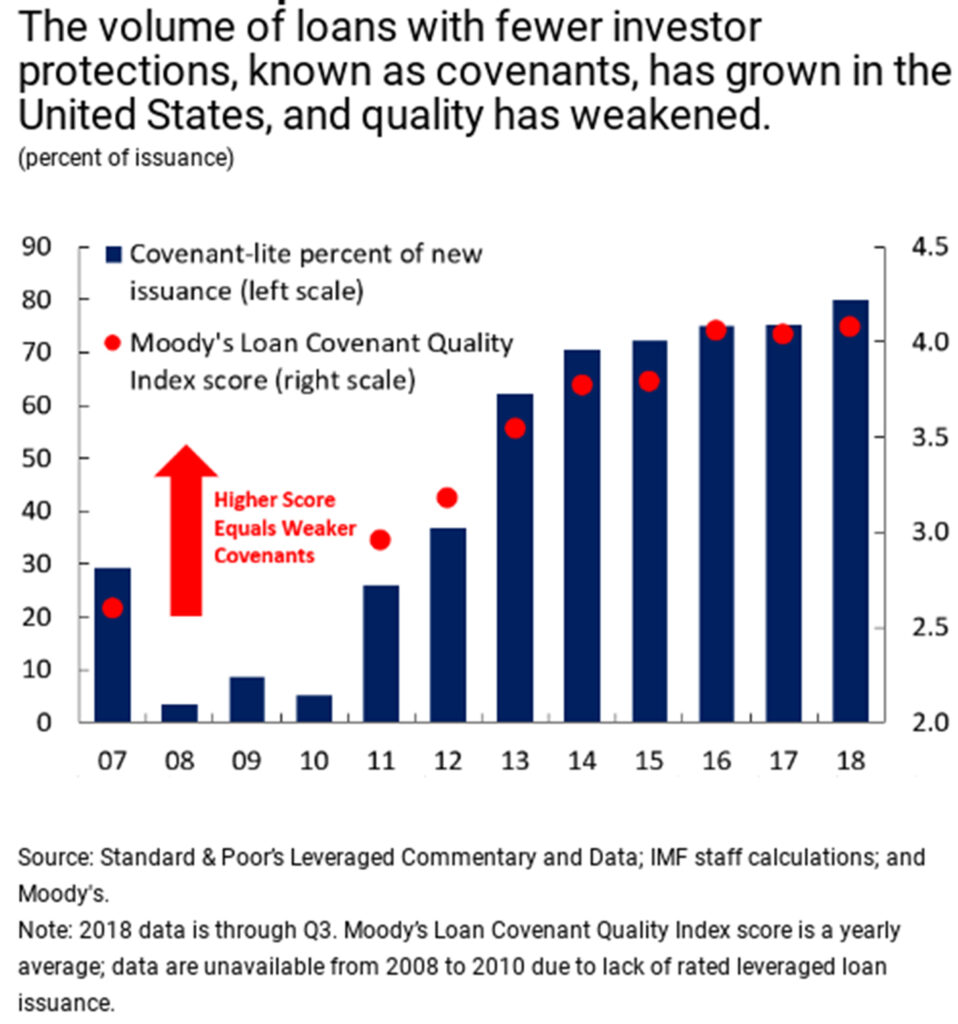
Stress in the leveraged loan market can impact IG investors in several ways. Existing bank commitments for loan syndication, committed funding facilities extended to leveraged borrowers, and committed funding facilities extended to investors with leveraged loan exposures could impact banks’ balance sheets directly. Greater demand for leveraged debt in recent years has served to turn the leveraged loan market into a buyers’ market. This has resulted in weaker covenant protections for investors and an increasingly larger portion of newly issued loans being “covenant-lite.” Such loans are making up a historically larger portion of leveraged loans outstanding, with investor protections experiencing dilution even within the “covenant-lite” category (Figure 14). While high covenant protections raise the probability of borrower default, weaker ones are likely to decrease recovery rates, resulting in higher losses for direct investors in the event of a downturn.
Figure 13: The Rise of the Shadow Banks
Source: Financial Stability Board’s Global Shadow Banking Monitoring Report (March 2018), Bloomberg, Investors Are Piling Into Loans That Banks Have Avoided Since the Crash
Figure 14: Less Investor Protection
Source: S&P Global Ratings, International Monetary Fund, Sounding the Alarm on Leveraged Lending
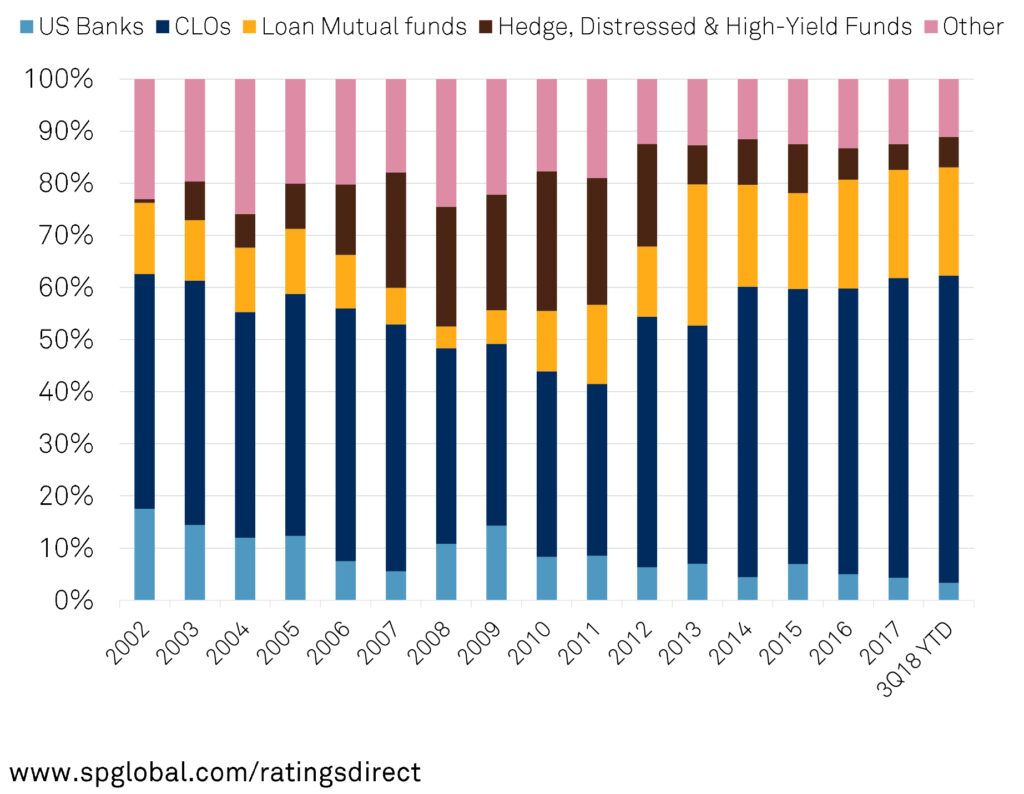
Adding another layer of complexity is the rise in Collateralized Loan Obligation (CLO) participation in the leveraged loan market (Figure 15).
Figure 15: Primary Investors in Leveraged Loans
Source: S&P Global Ratings
CLOs are investment vehicles that package leveraged loans into structured products, which can earn AAA ratings as a result of subordination. In recent years, they have become an increasingly important investment class, accounting for approximately half of all leveraged loans outstanding. By virtue of their high ratings, CLO obligations have likely made their way into bank, insurance company, and asset manager portfolios. While subordination is a legitimate means of credit enhancement, this additional layer of complexity constitutes another avenue of indirect exposure for IG investors to the health of the leveraged loan market.
Unexpected losses, especially during a downturn, could pressure business profiles as they are likely to coincide with lower revenues. The greater separation between ultimate CLO investors and CLO collateral pool assets also poses a risk given their high ratings, as fully vetting the security’s credit quality carries higher research costs. Low quality CLO pools, in the context of weaker covenant protections, could impact investor portfolios as subordination enhancements might turn insufficient in the event of a leveraged loan market liquidity shock.
Investor Sentiment/Liquidity Shock Risk: Market liquidity hinges on market participants’ willingness to transact. In effect, it exists so long as investors believe it does. Given the heightened sensitivity of the leveraged corporate sector to economic and industry shocks, especially as the recovery seems to be peaking, the likelihood of a market overreaction causing distortions to the real economy is also higher. This could give rise to a self-fulfilling prophecy, where expectations of lower liquidity result in a self-reinforcing cycle of negative sentiment and decreasing liquidity.
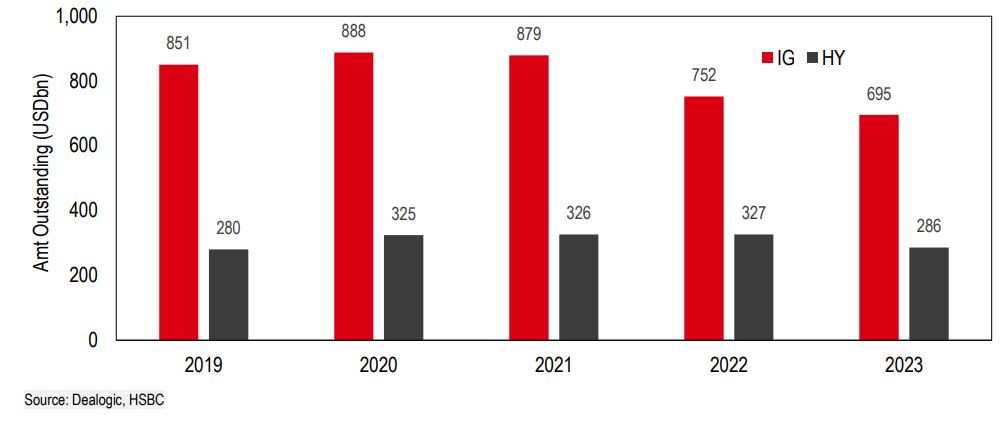
Behavioral effects of this type are not uncommon in equity markets, where availability biases result in instances of unwarranted overreaction to more recent information. While these types of short-term fluctuations are not generally cause for concern, the closer link between the credit markets and the real economy could create challenges. Figure 16 shows the corporate bond maturity schedule for the next five years: total corporate bonds outstanding at Q3 2018 stood at $6.2tn4, of which 90% will be repaid or refinanced by the end of 2023. As indebted companies seek to refinance their maturing debt, investor attitudes become increasingly important in facilitating the continuing function of the credit markets.
Figure 16: Corporate bonds Set to Mature Over the Next Five Years
Source: MarketWatch, These 5 charts warn that the U.S. corporate debt party is getting out of hand
An ill-timed short-term liquidity shock risks hampering the corporate sector’s ability to refinance. Prohibitively higher borrowing costs could significantly stretch affected firms’ interest coverage metrics, resulting in weaker credit profiles and impacting investor confidence.
Mitigating Factors
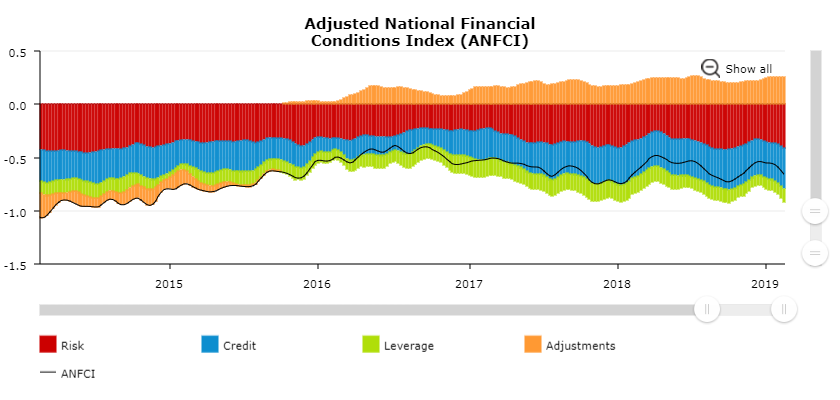
Overall financial conditions continue to appear relatively benign. The Chicago Fed’s Adjusted National Financial Conditions Index tracks potential market overreaction to the state of the economy by comparing the historical average correlation between financial market stress indicators and economic stress indicators. Values above zero indicate tighter than average conditions and vice versa. Figure 17 shows that financial markets are slightly more stressed than would be expected given their historical correlation to the broader economy, as indicated by the ‘Adjustments’ portion of the graph.
Figure 17: Adjusted National Financial Conditions Index (ANFCI)
Source: Federal Reserve Bank of Chicago, National Financial Conditions Index (NFCI)
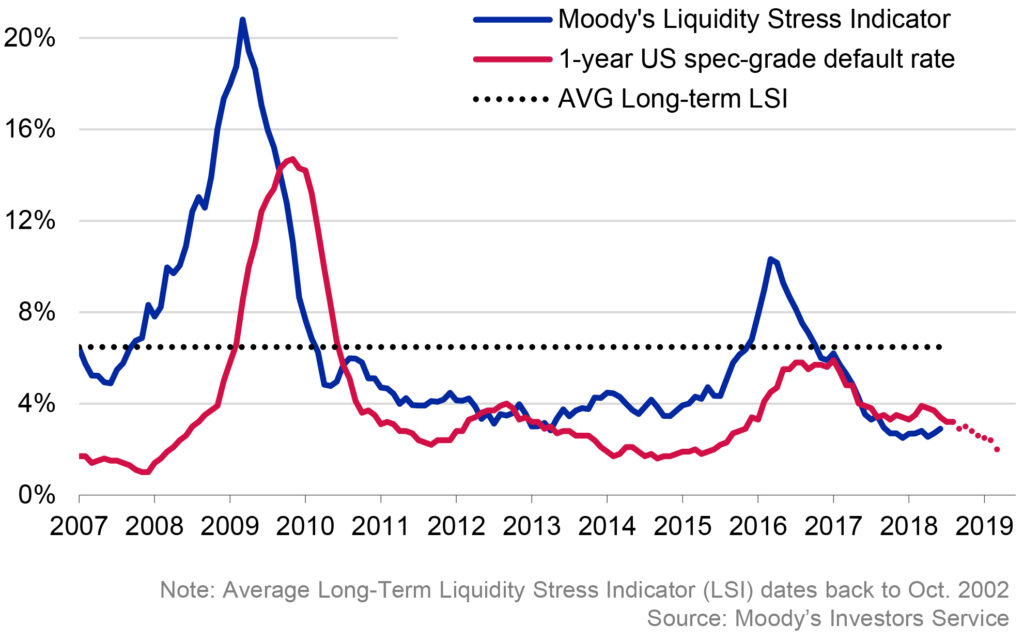
All in all, liquidity stress in the economy seems to be relatively benign (Figure 18). Furthermore, the Fed’s recent turn to a more dovish outlook should support the economy and help to keep credit conditions more accommodative for longer. This should support ongoing deleveraging plans and help maintain market access for levered firms looking to refinance.
Figure 18: Moody’s Liquidity-Stress Indicator Led Default-Rate Turns
Source: Moody’s Investors Service
Fallen Angel Risk
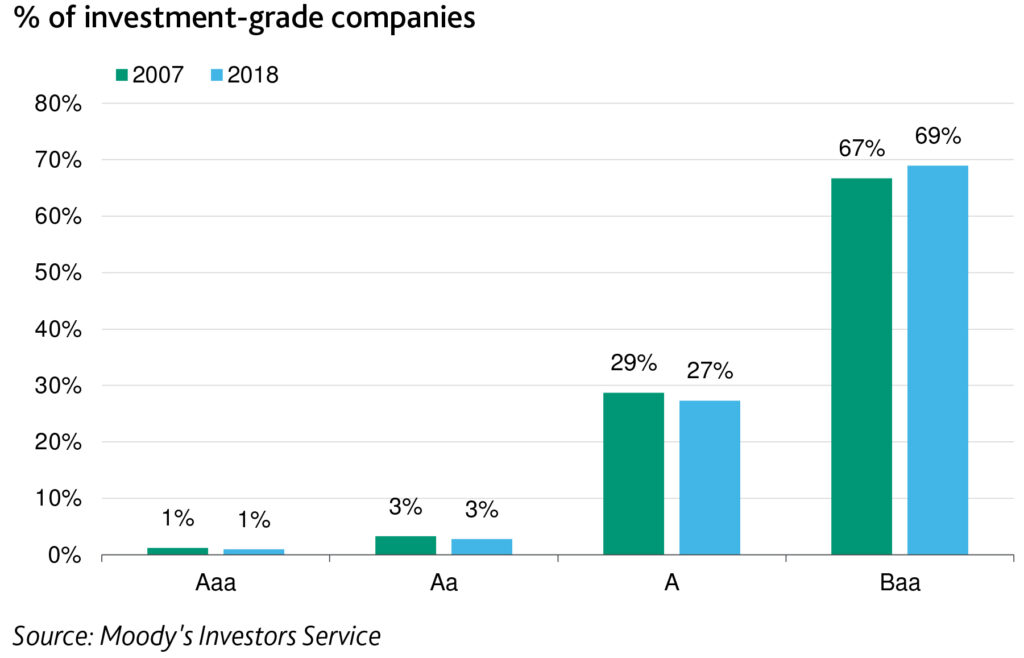
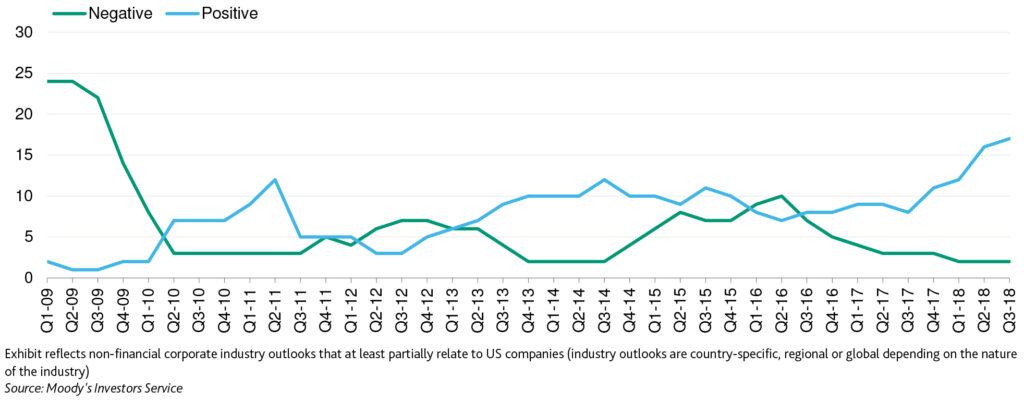
Despite the significant growth in BBB-rated debt over the past decade, the number of companies that comprise the BBB-rating tier has not increased materially (Figure 19). Importantly, ratings outlooks for corporate non-financial issuers are skewed towards the positive, implying lower risk of a downgrade over the ratings horizon (Figure 20).
Figure 19: Ratings Distribution of Investment-Grade Companies Has Remained Relatively Stable
Source: Moody’s Investors Service
Figure 20: Favorable Gap in Industry Sector Outlooks Continues to Widen
Source: Moody’s Investors Service
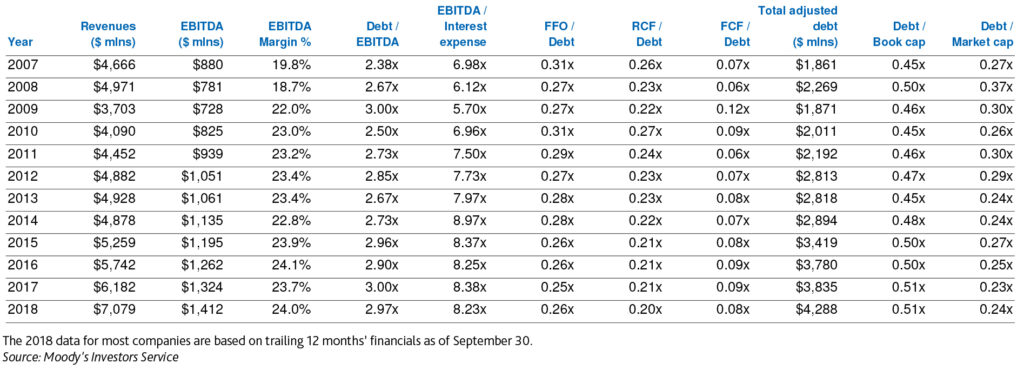
Fundamental leverage metrics of BBB-rated issuers do not appear to have deteriorated over time (Figure 21). This runs contrary to expressed concerns of weakening credit standards at the rating agencies, though continued strong earnings and cash-flow performance have become more important in maintaining leverage ratios at healthy levels. This does introduce a cyclical component to issuer ratings, however, it is at least partially mitigated by the fact that the vast majority of BBB-rated issuers operate in defensive, non-cyclical sectors.
Figure 21: Median Credit Metrics for Baa-Rated Companies Indicate Stable Credit Strength
Source: Moody’s Investors Service
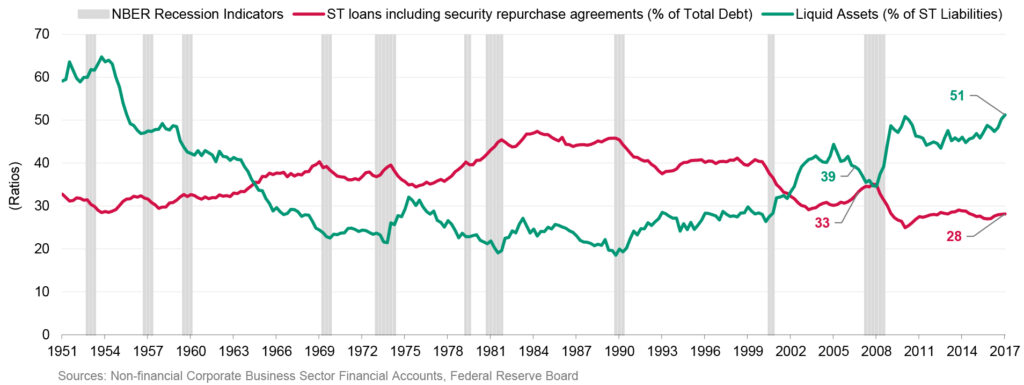
Liquidity profiles have improved since the last recession, with short-term market funding falling as a proportion of the total corporate funding structure, and liquidity buffers rising as a percentage of short-term funding liabilities (Figure 22). This should support continued funding in the event of a liquidity shock, while also providing a buffer against circumstantial credit quality deteriorations.
Figure 22: Liquid Assets (Bread Measure) & Short-Term Loans Including Security Repurchase Agreements
Source: Moody’s Investors Service
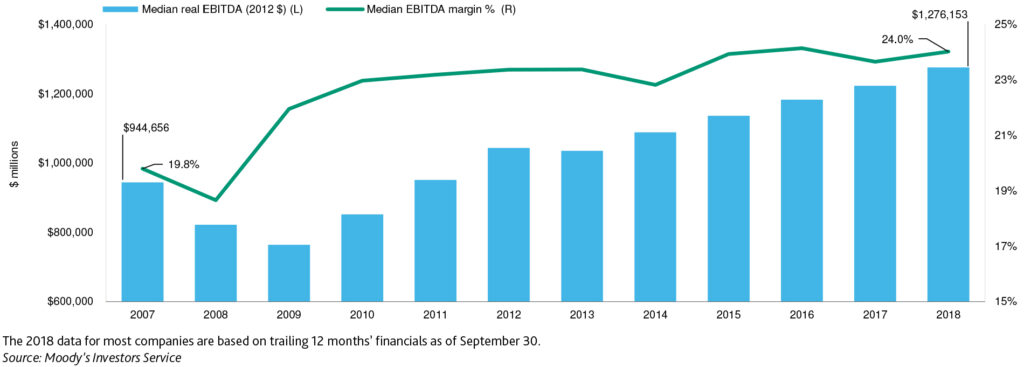
The rise in leverage is also linked with greater scale and profitability for BBB-rated issuers, as M&A activity contributed to all three. While higher post-acquisition targeted leverage puts downward pressure on ratings, this can be offset by greater scale and stronger competitive positions. This seems to have been the case for a large chunk of BBB-rated issuers (Figure 23).
Figure 23: Baa-Rated Companies Have Become Larger and More Profitable Since the Peak of the Last Economic Cycle
Source: Moody’s Investors Service
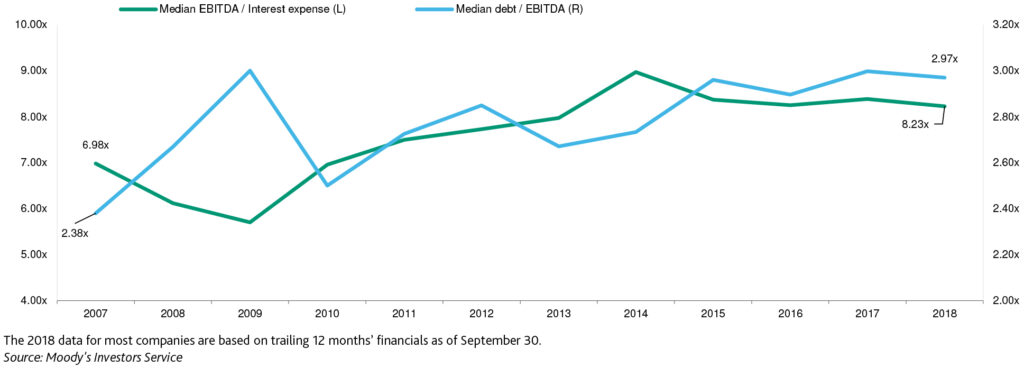
As Figure 24 shows, BBB-rated issuers today appear to be comfortably able to meet their debt service obligations.
Figure 24: Higher Coverage Offsets Higher Leverage of Baa-Rated Companies
Source: Moody’s Investors Service
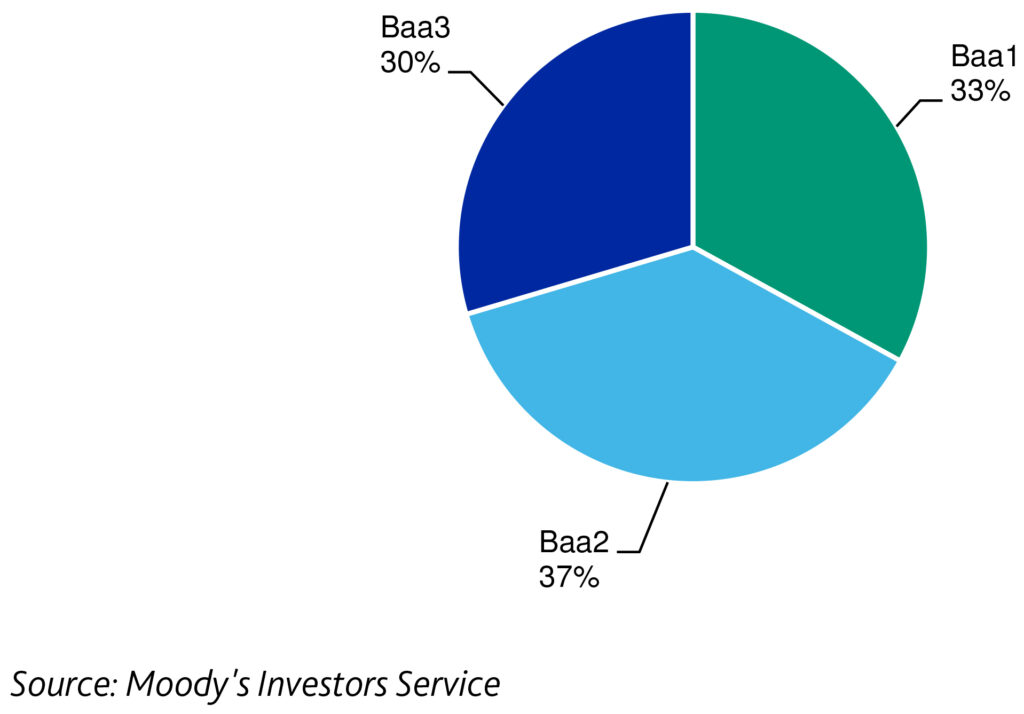
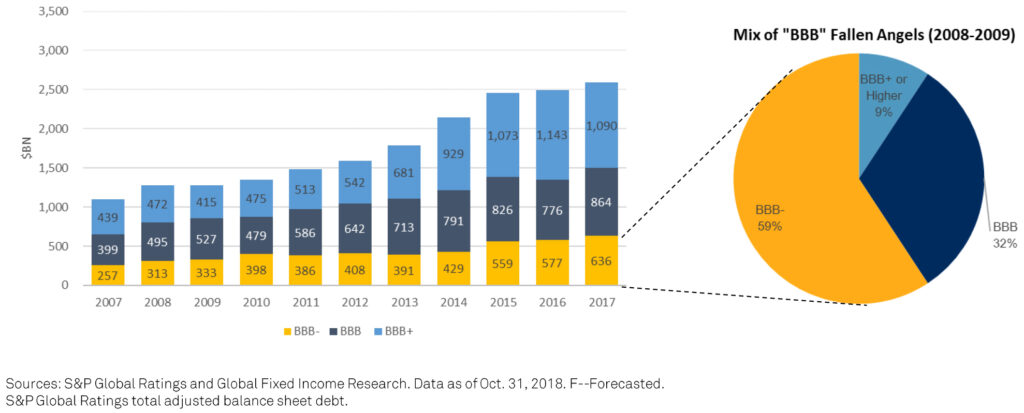
Aside from the benefits of larger scale and healthy leverage metrics, the majority of BBB-rated issuers also sit within the higher tiers of the BBB space, putting some distance between intra-IG downgrades and transitions to speculative grade (Figure 25). Looking to historical ratings performance, the majority (59%) of fallen angels during the 2008-9 recession came from the BBB- tranche (Figure 26).
Figure 25: One-Third of Baa-Rated Companies are Currently Rated Baa1
Source: Moody’s Investors Service
Figure 26: Growth in BBB Category Debt by Rating Level (2007-2017)
Source: S&P Global Ratings
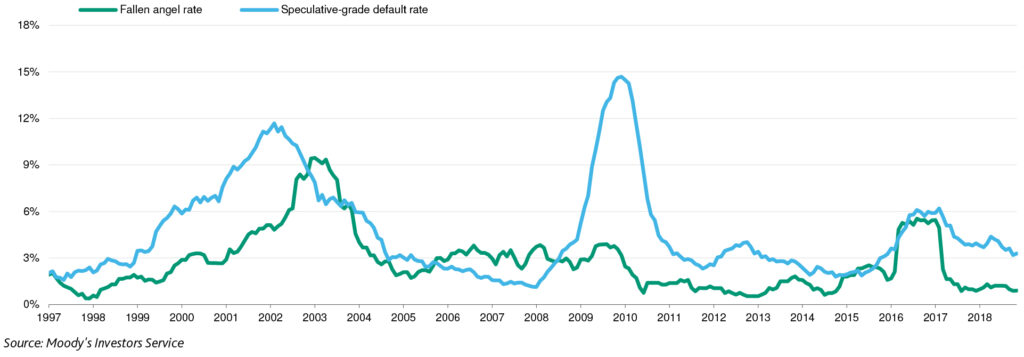
Furthermore, fallen angel risk has historically been correlated more with industry specific factors and less with the macroeconomy. The spike in the 2015-6 period relates to the oil & gas sector during the downturn in energy prices in that period (Figure 27).
Figure 27: Fallen Angel Rates Are Not Highly Correlated with Speculative-Grade Default Rates
Source: Moody’s Investors Service
Finally, large firms at risk of downgrade to speculative grade do carry aces up their sleeves. As shown on Figure 8 previously, a downgrade from BBB to BB comes with significant impact on spread that would impose significant going concern costs on the affected issuers. Management teams faced with an increased risk of rating relegation to speculative grade may resolve to decrease investor payouts, limit CapEx spending and/or sell company assets to reduce leverage and maintain their IG status. Figure 4 shows a decrease in debt funded investor payouts from 2017 onwards which coincides with the emergence of concerns over leverage in corporate balance sheets. This could serve as an indicator that management teams remain committed to maintaining their IG status going forward.
Contagion Risk
The regulatory response to the 2008-9 financial crisis contributed materially to the resilience of the financial system. Stricter bank regulation boosted capital reserves and resulted in banks that are stronger and safer. Tighter credit standards have supported bank credit profiles, while limiting exposure to complex assets.
CLOs bear resemblance to the CDOs that were a central piece of the past financial crisis, however, circumstances today differ in two important ways. First and foremost, banks are much less exposed to such instruments, holding approximately 10% of outstanding securities in their portfolios, which predominately fall into the AAA to A-rated tranches of the subordination waterfall. Furthermore, CLOs themselves maintain larger subordinate tranche buffers than in the past, providing an increased cash-flow backstop to support contractual payments. Current AAA-rated CLO tranches have a 36%5 subordination protection on average, meaning that the CLO would have to experience 36% of cumulative losses before the performance of the AAA tranche is affected.
Direct exposure to leveraged loans through bank syndication has also de-risked since the past recession, with lender consortia being larger and with each member bank taking up smaller proportionate exposures to the credit quality of the borrower.
Lastly, asset specific characteristics of leveraged loans, such as first lien on borrower assets and secondary market liquidity provided by price indices, may offset a significant portion of the increased credit risk posed by weaker covenant restrictions. Historically, capital structure seems to have more of an influence on recovery performance than covenant protections. During the previous recession, leveraged loans experienced a cyclical peak annual loss of 3.8%6. The current base case scenario is that an upcoming recession will not be as severe as the one seen during 2008-2009.
Recommendations for Cash Investors
While the probability of a severe shock impacting IG portfolios remains low, investors would do well to be prepared. In-depth due diligence and continuous monitoring of existing positions is always the first line of defense against any risks to the outlook. This is especially true under current circumstances where higher levels of corporate leverage raise the sensitivity of levered firms to shocks.
Investors should evaluate the historical earnings and cash-flow stability of levered firms and be mindful of industry specific sensitivities. Access to liquid resources in the event of tightening credit conditions and/or an earnings downturn could be a deciding factor between sustaining an IG rating or falling into the SG space. Digging deeper into portfolio holdings to identify ultimate exposures should also serve to protect investors from any unwanted surprises.
Qualitative review of management team attitudes and competencies should also rank high on investors’ due diligence checklist. Corporate financial policy should match the current stage of the business cycle, while the appropriateness of existing deleveraging plans and management’s ability and experience in delivering results should be scrutinized.
Investors should also pay mind to existing debt cushions within the corporate debt capital structure as a means of calibrating their portfolio risk exposures. A larger debt cushion would be supportive of the credit quality of senior debt and could help maintain IG ratings on holdings of such debt even in the event that the issuer is downgraded.
Lastly, keeping close track of the evolution of endogenous (Fed tightening) and exogenous (Brexit, trade war, China hard landing) risks over time as they relate to both the broader economy as well as specific industries can help avoid surprises. It is worth remembering that the severity of the downturn is the primary determinant of credit risk.
Conclusion
In this paper we examined two credit themes that have recently garnered increased attention from market participants. Corporate leverage has changed the IG landscape by significantly increasing the volume of BBB-rated debt outstanding, while fast-paced growth in the leveraged debt markets has led to increased risk-taking and weaker investor protections. This raises the stakes for IG investors as a large portion of IG issuers have come closer to a speculative grade rating, and financial institution exposure to leveraged loans hints at possible contagion risks. In the context of a maturing expansion, these risks could contribute to a tighter credit environment and raise the sensitivity of issuers to liquidity shocks.
Upon further review, we find that the larger scale, profitability, and liquidity of levered firms support their business profiles. While BBB-rated issuers have increased in frequency, most of them fall within the BBB+ and BBB notches, putting some distance between them and a downgrade to speculative grade. Furthermore, earnings stability, with the majority of levered firms operating in non-cyclical industries, is likely to support deleveraging efforts throughout the business cycle. In the event that an upcoming downturn is more severe than expected, large BBB-rated issuers also have alternative means of maintaining their ratings status through decreased investor payouts, lower business investment and asset liquidations. Lastly, continued regulatory efforts to fortify the financial system after the last recession have resulted in a more resilient banking sector. While bank credits could be impacted both directly, through their exposures to leveraged debt, and indirectly, through their business with directly exposed firms in the event of a crisis, any resulting losses are likely to be small and manageable. Nevertheless, investors should remain vigilant, keeping a close eye on evolving market conditions and relying primarily on in-depth quantitative and qualitative due diligence when selecting investments.
Our research is for personal, non-commercial use only. You may not copy, distribute or modify content contained on this Website without prior written authorization from Capital Advisors Group. By viewing this Website and/or downloading its content, you agree to the Terms of Use.
1Issuer Quality and Corporate Bond Returns, Robin Greenwood and Samuel G. Hanson; Credit Expansion and Neglected Crash Risk, Matthew Baron and Wei Xiong; Credit-Market Sentiment and the Business Cycle, David López-Salido, Jeremy C. Stein, and Egon Zakrajšek
2Henri Servaes , Ramin Baghai and Ane Tamayo, Have credit rating agencies become too lenient?, London Business School, May 31, 2017, https://www.london.edu/faculty-and-research/lbsr/have-credit-rating-agencies-become-too-lenient
3Barclays – Credit Research; US Credit Strategy – Big BBBs Won’t Break Bad (January 17th, 2019)
4Board of Governors of the Federal Reserve System (US), Z.1 Financial Accounts of the United States
5Wells Fargo – FAQ on CLOs and Leveraged Loans
6Wells Fargo – FAQ on CLOs and Leveraged Loans
Please click here for disclosure information: Our research is for personal, non-commercial use only. You may not copy, distribute or modify content contained on this Website without prior written authorization from Capital Advisors Group. By viewing this Website and/or downloading its content, you agree to the Terms of Use & Privacy Policy.
