
June Month-End Portfolio Update
Retail Sales Disappoints, Again
For the second consecutive month, retail sales came in lower than expected and showed signs that the effects of higher borrowing costs could be impacting US consumers. The May reading rose +0.1% while the flat April reading was revised lower to -0.2%. The Control Group, which feeds into the consumption component of GDP, also came in lower than expectations at +0.4% while April’s Control Group reading was revised lower to -0.5%, the biggest decline in almost a year. Retail Sales primarily measure goods purchased, as only 1 of the 13 sub-categories comprise services. That one service component is purchases at restaurants and bars, which declined -0.4%, the most since January. Considering Retail Sales is unadjusted for inflation, which remained positive but cooling during the period, the negative revisions indicate a significant slowdown in spending. In addition to Retail Sales, the Personal Spending report also came in lower than expectations while the Personal Consumption component for Q1 GDP was revised lower to +1.5%, a significant revision from the initial estimate of +2.5%.

Fed’s Preferred Inflation Gauge Shows Lowest Reading of 2024
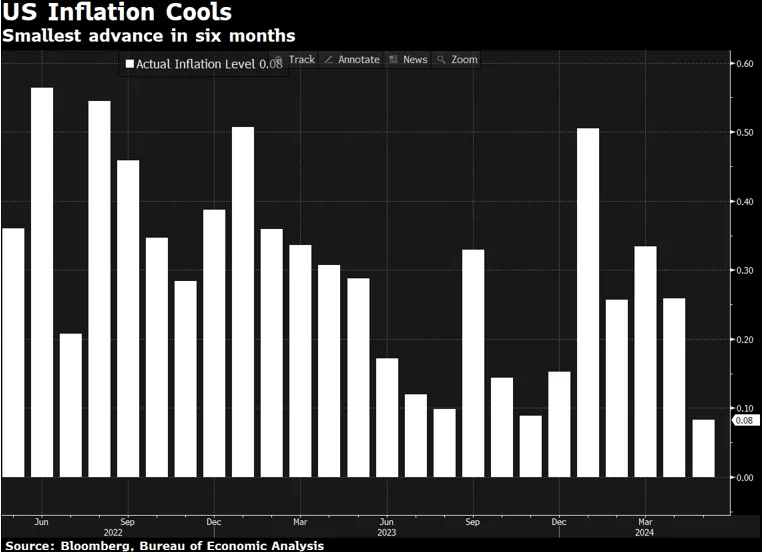
The Personal Consumption Expenditure Price Index (PCE) for May reported the lowest levels of inflation this year primarily due to declining gasoline and durable goods prices. Headline PCE came in flat while Core PCE registered the smallest unrounded increase since November 2020 at +0.083%. This brought the annual reading down to +2.573% which is the lowest since March 2021. The 3-month annualized rate is now at +2.7%, which is much improved from the +4.5% reported in March. Supercore PCE, which is one of Fed Chair Powell’s preferred gauges, rose +0.1% month-over-month while the annual rate rose +3.4% and has remained stubbornly sticky around the +3.5% range for approximately the past 6 months. Despite the stickiness from Supercore inflation, May’s overall inflation readings keep the possibility of a September rate cut on the table for the Fed.

2024 Mid-Point Performance Recap
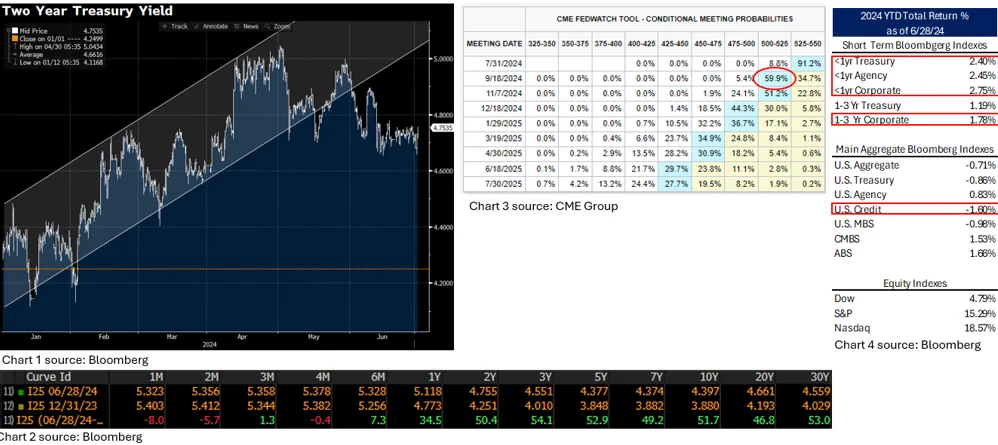
The first half of 2024 has been volatile from a rates perspective, with yields rising in the first quarter (measured by the 2-year Treasury yield: Chart 1), on a strong labor market and hotter than expected inflation readings. The second quarter saw rates decline on slowing economic data along with improving inflation readings. On a year-to-date basis, yields from 1- to 30-years are still 30 to 50 basis points higher (Chart 2), despite the recent decline in yields in May and June. However, front-end yields are little changed as expectations are for the Fed to keep rate cuts on pause until the FOMC’s September 18th meeting (Chart 3). This is also reflected in year-to-date index returns showing short-term indexes outperforming their longer duration counterparts (Chart 4).

This information was prepared by Capital Advisors Group, Inc. from outside sources which we believe to be reliable. However, we make no representations as to its accuracy or completeness. The economic statistics presented in this report are subject to revision by the agencies that issue them.
Please click here for disclosure information: Our research is for personal, non-commercial use only. You may not copy, distribute or modify content contained on this Website without prior written authorization from Capital Advisors Group. By viewing this Website and/or downloading its content, you agree to the Terms of Use & Privacy Policy.
