
Do BBB Corporate Bonds Belong in Treasury Management Portfolios?
Co-authored by: Matthew Paniati, CFA®
DOWNLOAD FULL REPORT
Abstract
BBB-rated debt continues to offer new possibilities for cash investors. Though it involves taking on incremental credit risk, allowing the purchase of these securities may help alleviate supply shortages while also offering additional return opportunities. Should investors investigate adding BBB names to their portfolios, we recommend that they follow these principles.
Guiding Principles:
1. Expect lower market liquidity
2. Steer clear of BBB financial issuers
3. Credit research is essential
4. Use BBB debt as part of a conservatively constructed core portfolio
Introduction
Back in 2015, in the light of money market reform and the trend of falling credit ratings, we looked at the BBB debt market. We asked whether portfolio managers could tap this market, which traditionally has been ignored by cash investors, to alleviate supply constraints and add incremental return. We concluded that the market did offer opportunities, but that it would only be suitable for a segment of Treasury portfolios.
Four years on, the BBB market has grown even further in both size and prominence. As ratings continue their systematic downward drift, BBB debt is becoming a more attractive option for cash investors who maintain strict concentration limits while looking for high-quality names and significant return over government securities. Even so, limits on the purchase of BBB rated debt are generally quite stringent.
In this piece, we analyze whether the case for adding BBB names has changed. What is the risk of adding BBBs to the portfolio, and is there requisite return to compensate for this risk? How does owning BBB debt compare to owning debt higher up the ratings ladder in terms of credit quality and potential ratings volatility? And finally, what are some guiding principles for cash investors thinking of entering the space?
BBB Ratings Explained
For starters, the BBB designation refers to a level of “investment grade” creditworthiness evaluation used by nationally recognized statistical rating organizations (NRSROs, or “rating agencies”). Moody’s, Standard & Poor’s and Fitch designate investment grade debt in one of four categories—AAA, AA, A and BBB—representing “highest quality,” “high quality,” “upper medium grade” and “medium grade,” respectively. Ratings of BB, B, CCC, CC, C and D are considered “below investment grade” or “junk1”.
Similarly, short-term commercial paper obligations have short-term ratings, with a “Tier 1” designation (P-1 by Moody’s, A-1 and A-1+ by S&P, F1 and F1+ by Fitch) roughly corresponding to AAA, AA, and mid-level A ratings, “Tier 2” corresponding to lower-level A through mid-level BBB, and “Tier 3” corresponding to lower-level BBB. Below-investment-grade issuers typically have their short-term ratings assigned “Not Prime” (NP).
In other words, when we speak of BBB-rated securities, we are referring to debt instruments still of investment grade quality, albeit at the lower rung of the credit ladder. For simplicity’s sake, we’ll use BBB long-term and Tier 2 short-term designations interchangeably.
Strong Presence in the Corporate Debt Market
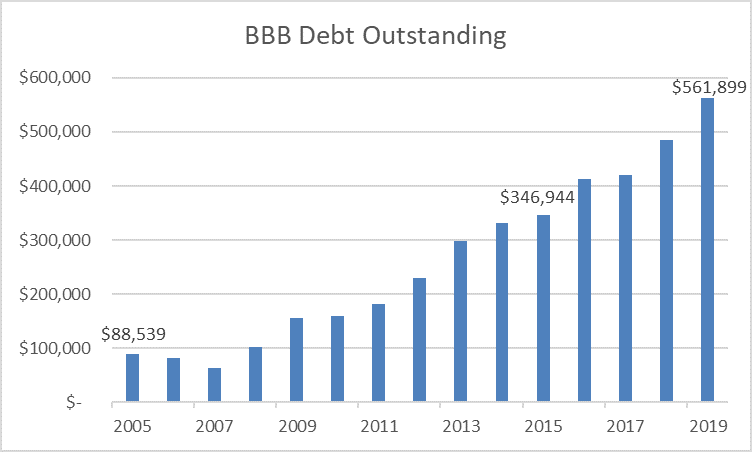
Since our last article on corporate debt, the BBB segment of the debt market has grown even further. Figure 1 illustrates this point, using the Merrill Lynch 1-3 Year Corporate Index as a proxy for the short-term investment grade market. Growth in BBB debt has been virtually unabated since 2005, rising more than 6-fold over the past fourteen years. In just the past year alone, BBB debt outstanding increased by $76 billion, more than the entirety of the BBB market in 2007.
Figure 1: Growth of BBB Debt in Merrill 1-3 Year Corporate Index

Source: All Merrill Lynch index data are as of May 31, 2019 as available on Bloomberg.
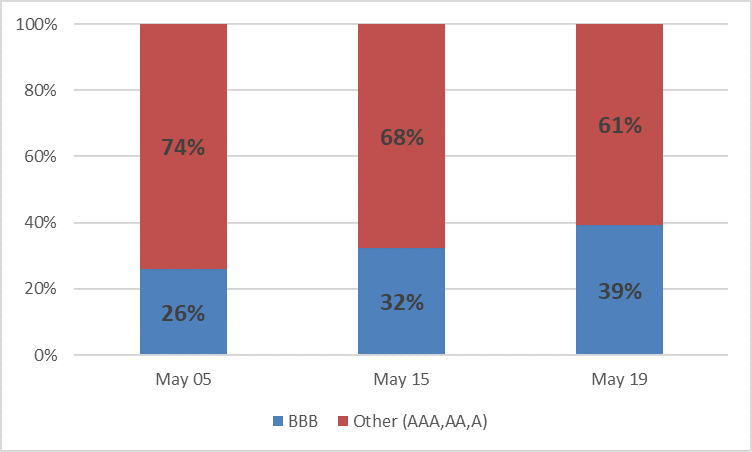
Figure 2 further highlights this point, comparing the composition of the Merrill index at various points in time. It is now clear that the composition of the investment-grade space has tilted significantly towards BBB issuers, as firms have become comfortable with lower credit ratings so long as they maintain their investment-grade status. In the past year alone, a number of well-known industrial companies, including General Electric, United Technologies Company, and Bayer AG have been downgraded into the BBB space. This trend is expected to continue going forward, as companies adopt more aggressive financial policies to deal with an environment of chronically lower growth and interest rates.
Figure 2: Merrill 1-3 Year Corporate Index Composition
Source: All Merrill Lynch index data are as of May 31, 2019 as available on Bloomberg.
Similar trends can be found in the short-term debt market. While aggregate commercial paper issuance has remained relatively stable, the amount of Tier-2 paper outstanding continues to rise. As Figure 3 illustrates, Tier-2 commercial paper outstanding has risen by nearly 50% over the past four years, and now makes up roughly 9% of the entire market.
Figure 3: Commercial Paper Outstanding

Source: Bloomberg as of May 31, 2019
The larger representation of lower investment-grade debt, in and of itself, does not indicate sufficient creditworthiness for inclusion in treasury portfolios. It does, however, speak to the growing breadth and liquidity of this debt category as compared to decades past and relative to debt in other rating tiers.
This new reality calls for a closer look at BBB-rated non-financial issuers, as they could enable greater risk diversification and offer supply relief in a market traditionally dominated by confidence-sensitive financial institutions’ debt.
Marginally Higher Credit Risk
For credit instruments to be considered as potential investments, the most relevant question is whether the risk assumed is consistent with the principal preservation and liquidity objectives of treasury investments. To evaluate incremental credit risk, we review the annual default studies and ratings migration reviews conducted by Moody’s2:
Figure 4: Moody’s Annual Corporate Default Rates by Ratings (1920-2018)

Source: Moody’s Default Study 2019
Figure 4 shows insignificant differences in default rates among various investment-grade rating categories over the past 98 years. The average annual default rate among BBB (Baa) issuers over the period of 1920-2018 was 0.26%, compared to 0.09% for A-rated issuers and 0.06% for AA corporates. Default rates for BBBs were slightly higher than for A-rated issuers during the crisis, at 1.02% in 2008 and 0.93% in 2009 vs. 0.40% and 0.24%, respectively. However, the average default rate of BBB issuers since 2009 is just 0.08%, and there have been zero BBB defaults since 2014.
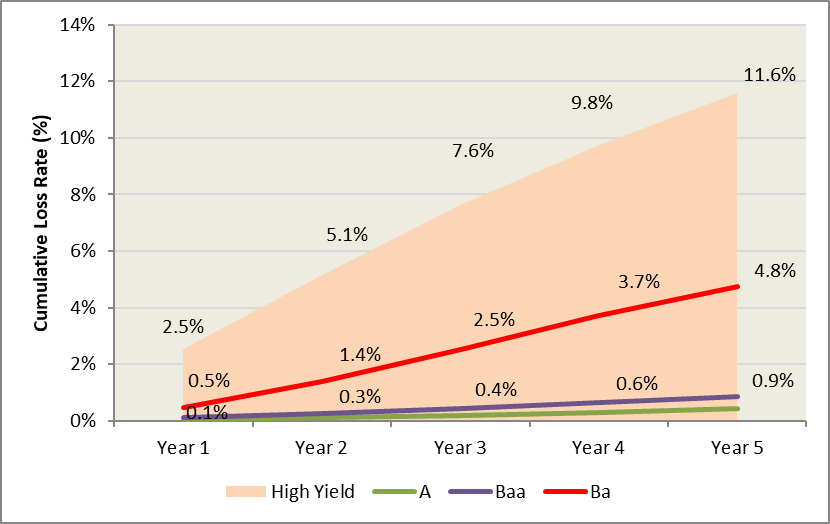
The limited credit risk of BBBs is further illustrated by expected loss rates. Expected loss is a more all-encompassing evaluation of credit risk, as it combines the probability of default with the expected loss of principal in the case of default. As Figure 5 illuminates, expected losses on BBB-rated bonds are not materially different from those of higher credit quality. Over a one-year time horizon (generally the range of most Treasury portfolios) the expected loss on BBB bonds is just 0.09%, and over a five-year period it remains below 1%.
Compare this to loss rates on high yield bonds. Despite the close proximity in rating, expected credit losses at the BB (Ba) level are materially greater. Over a five-year horizon, expected losses rise to nearly 5%, more than 5 time greater than that of BBB names. This trend continues exponentially down the ratings scale, with issuers in the C range posting an expected loss rate north of 20% over the same horizon.
Figure 5: Average Cumulative Credit Loss (1982-2018)
Source: Moody’s Default Study 2019
Given the short time-horizon of most cash investors, the real risk of investing in BBB lies in the potential for ratings downgrades rather than outright default. Over the investment horizon of a cash portfolio, the chance of downgrade to the lower end of BBB, or to outright BB, is material. Moody’s historical data on ratings movements suggests that over the course of a year there is a 4.5%3 chance of a BBB name being downgraded out of investment grade, compared to a 4.2% chance of it being upgraded (Figure 6).
Figure 6: Average 1-Year Rating Migration (1920-2018)

Source: Moody’s Default Study 2019
For short-term debt, the most recent default and ratings migration study by Moody’s was as of 2017. It found that, over a period of 365 days, 4.6% of initial P-2 ratings were downgraded, 7.8% were withdrawn and 0.10% defaulted. This data series was based on an observation period of 1972-20174.
We should note that these Moody’s statistics include financial firms whose ratings tend to be more vulnerable under extreme market conditions. Excluding these firms would give a truer indication of both default and ratings risk for treasurers looking to invest in BBB names.
Cyclical Considerations
As noted in our February whitepaper “Corporate Leverage: Par for the Course or a Harbinger of an Upcoming Crisis?” cyclical factors also come into play when evaluating the BBB space. This current expansion is now a decade old, the longest on record, and the unemployment rate is sitting at a 50-year low of just 3.6%. Furthermore, the yield curve5 has been inverted for over a month now.
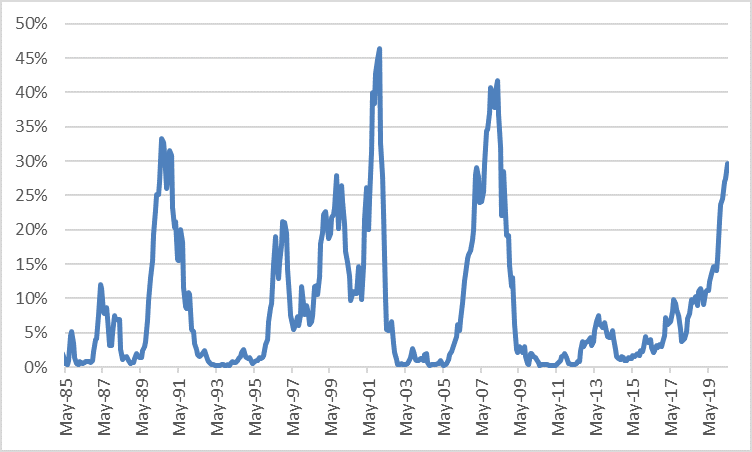
While none of these guarantee an end to the current expansion, they are all factors that portend a greater risk of recession over the next twelve- to twenty-four months. Compared to other developed economies, the business cycle in the U.S. is more volatile, and tends to reverse itself when unemployment bottoms out. Additionally, as San Francisco Fed economists Michael D. Bauer and Thomas M. Mertens noted, a yield curve inversion is a “fairly accurate predictor” of future recessions. The New York Fed’s yield curve recession model further elaborates on this point, putting the chance of recession in the next twelve months at 30%.
Figure 7: Probability of US Recession Within 12 Months, Predicted by Treasury Spread
Source: NY Fed
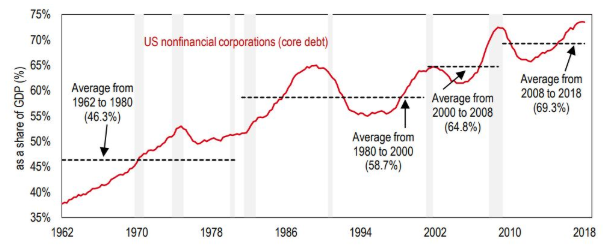
A turn in the cycle presents some downside risk for investors in BBBs. While default risk would likely remain low, ratings volatility would likely pick up, as evidenced in 2008 and 2009. This is especially true as corporate leverage advances to new highs.
Figure 8: U.S. Nonfinancial Corporate Debt as Percentage of GDP
Source: MarketWatch, HSBC, BIS
Higher leverage could induce excess ratings sensitivity in the event of a downturn, as a drop in revenues could squeeze margins and weaken debt-service capabilities. This risk is particularly acute for BBB- names, as a one-notch downgrade out of investment grade could subsequently result in materially higher borrowing costs, thereby inhibiting their ability to cost-effectively refinance outstanding debt.
Incremental Return Potential
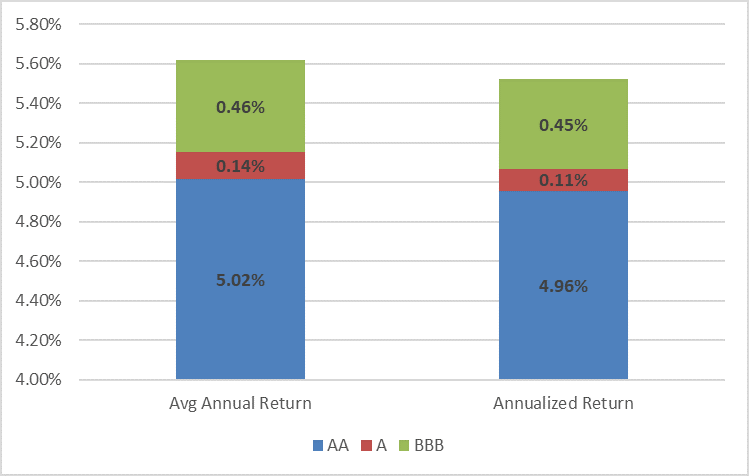
If investors are willing to take on this incremental credit risk, they can be expected to receive higher return to compensate for it. Empirical evidence over the last 30 years in Merrill Lynch 1-3 Year Corporate Index components supports this notion of greater return potential.
Figure 8: Total Return by Ratings (Merrill 1-3 Year Corporate Index components, 1989-2018)
Source: All Merrill Lynch index data are as of May 31, 2019 as available on Bloomberg.
Figure 8 shows that, over the last 30 years, the AA-rated cluster in the Merrill 1-3 Year Corporate Index had an annualized return of 4.96%. The A-rated cluster performed similarly, its annualized return of 5.07% offering just 11 bps of excess return.
On the other hand, BBBs showed significant outperformance, with an annualized return of 5.52% offering 45 bps of excess return over the A-rated component and 56 bps over the AA-rated component. For reference, on a portfolio of $10 million, the 45 bp spread translates to roughly $227,000 in additional return over a five-year time horizon.
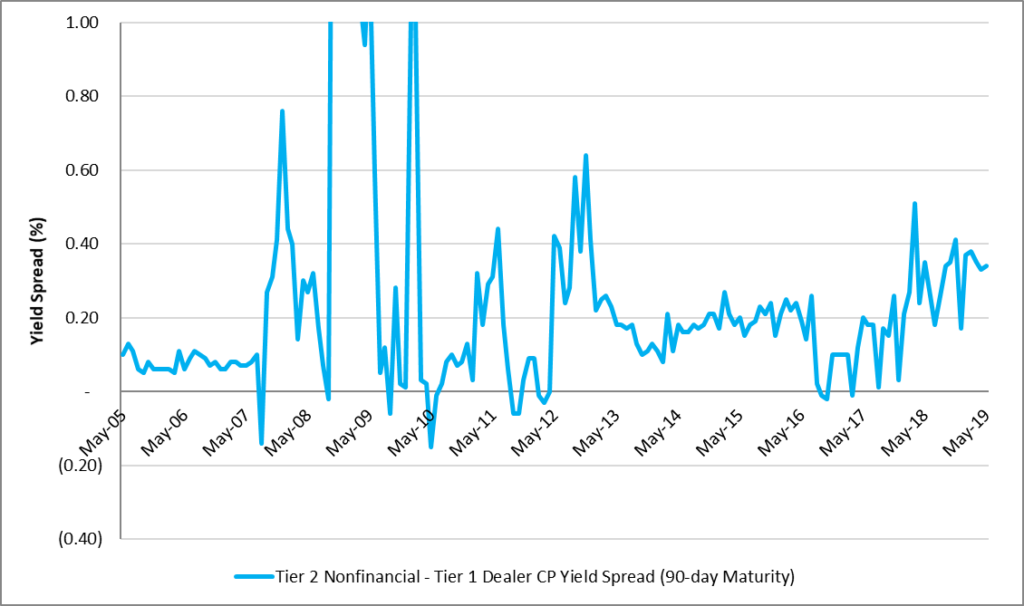
Figure 9: Yield Spread of 90-Day Tier-2 Non-financial to Tier-1 Dealer Placed CP
Source: Bloomberg Money Market Rate Curve as of May 31, 2019.
In the CP market, the average yield spread of Tier-2 90-day non-financial CP to Tier-1 dealer placed CP has been 0.28% for the last fifteen years, slightly below the level today. In 2019, the widest month-end spread was 0.38% on February 28th and the narrowest was 0.17% at the start of January. During the financial crisis in 2008, this spread understandably spiked to 4.88% shortly after the Lehman Brothers bankruptcy.
An Opportunity Set Unavailable in the Money Market Fund World
With the implementation of the Securities and Exchange Commission’s (SEC’s) money market fund reform in October 2016, participants in the money market fund space have experienced a supply shortage in high-quality eligible investments. Short-term T-Bill issuance remains strong due to higher budget deficits, and agency debt remains relatively unchanged from the levels seen the past few years (in both dollar amount and maturity profile). However, as ratings on the corporate end continue to drift lower, the available supply of non-government affiliated Tier-1 debt is dwindling.
In this backdrop, BBB-rated securities introduce an additional source of supply unavailable to most money market funds. For prime money market funds, SEC rules limit Tier 2 concentration to 3% of a portfolio and with a maximum maturity of 45 days. Single issuer concentration is limited to 0.5%. Note that rating agencies often have more stringent criteria for funds to retain their AAA ratings than the rules prescribed by the SEC.
Accounts unconstrained by these restrictions will have the flexibility to add credit or duration exposures to BBB issuers through direct purchases or separately managed accounts.
Treasury Portfolio Considerations
BBB-rated corporate bonds have the positive attributes of broader supply, improved risk diversification, moderate default and ratings migration risk, and attractive yield potential. These attributes need to be viewed in the context of treasury management organizations, which tend to emphasize principal preservation and liquidity more than income objectives in their investment portfolios. Institutional cash investors may do well observing the following guiding principles.
- Expect lower market liquidity: Although BBB-rated corporate securities are of investment grade quality, market acceptance tends to be more limited. The lower acceptance often leads to lower secondary market liquidity, as fewer potential buyers are available. Liquidity risk may be at least partially mitigated by staying shorter, allowing purchases to mature on a regular basis to produce organic liquidity rather than relying on secondary market bids.
- Steer clear of BBB financial issuers: Both corporate and financial debt issues can be found in the corporate debt market. It would be a mistake to think that all BBB-rated debt is alike. The creditworthiness of an issuer depends on many factors, including its business model, operating and financial conditions, and susceptibility to external factors. Decades of empirical evidence has shown that ratings on financial firms tend to be more volatile due to the confidence-sensitive nature of their business models and reliance on market funding. Staying with non-financial issuers may help limit ratings risk and reduce market value swings.
- Credit research is essential: Investors should not be solely reliant on rating agencies in determining credit quality. BBB issuers are more varied in scope and quality than their higher-rated peers, requiring a more granular level of analysis. At the lowest rung on the investment-grade ladder, slippage in credit performance may land a BBB investment in “junk” status. A focus on monitoring of company fundamentals, sectoral trends, and macroeconomic environment can mitigate the risks of buying low quality names.
- Use BBB debt as part of a conservatively constructed core portfolio: For investors who deem BBB debt suitable for a treasury portfolio, portfolio construction should start with a core base of high-quality liquid investments, while BBB debt is layered in as an attractive risk diversifier and yield enhancer. When this portion is managed as part of an integral portfolio or as a separate sleeve within a larger portfolio, investors should be aware of liquidity and market value implications.
Conclusion – BBB Debt is not for Every Treasury Portfolio
In light of recent corporate debt market trends, we continue to believe that BBB debt may offer benefits in the form of greater supply, risk diversification, and yield enhancement for cash portfolios. It should be noted, however, that adding BBB debt is not ideal for all treasury organizations, as risk cultures, liquidity constraints, and return expectations vary. As yield and supply challenges intensify in the short-duration debt market, organizations that are able to take advantage of this debt class may be well compensated for the moderately higher credit and liquidity risk it represents.
DOWNLOAD FULL REPORT
Our research is for personal, non-commercial use only. You may not copy, distribute or modify content contained on this Website without prior written authorization from Capital Advisors Group. By viewing this Website and/or downloading its content, you agree to the Terms of Use.
1Refer to SIFMA’s investinginbonds.com website. https://www.investinginbonds.com/learnmore.asp?catid=10&subcatid=47&id=182
2Moody’s Default Study 2019
3This excludes the event of a ratings withdrawal or default.
4Moody’s Commercial Paper Default Rates https://www.moodys.com/researchdocumentcontentpage.aspx?docid=PBC_1103652
5As measured by the spread between the 3-month Treasury Bill and the 10-year Treasury Note
Please click here for disclosure information: Our research is for personal, non-commercial use only. You may not copy, distribute or modify content contained on this Website without prior written authorization from Capital Advisors Group. By viewing this Website and/or downloading its content, you agree to the Terms of Use & Privacy Policy.

