War Chest: Exploring the Cash Holdings of Big Tech
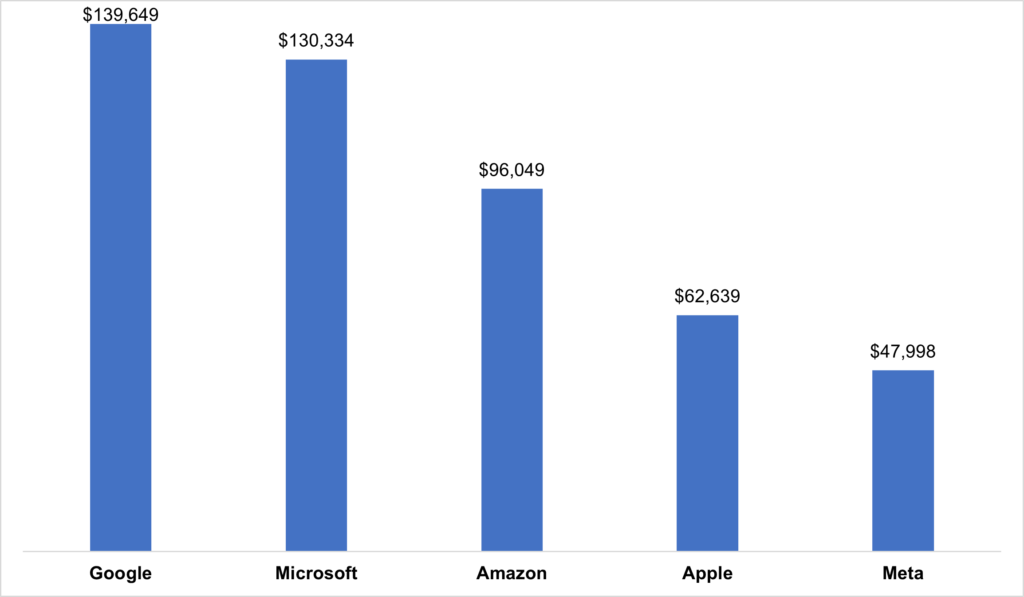
It’s no secret that tech giants enjoy healthy profits, but less well known is just how much cash these cash cows have. At the end of 2021, Big Tech (Apple, Alphabet Inc., Amazon, Microsoft, and Meta) held a combined $476.7 billion of cash, cash equivalents, and marketable securities. To put that into perspective, this is roughly equivalent to the Bank of Canada’s total assets of $499.3 billion in the same period.1 With the exception of Meta, which does not issue debt, these reserves ultimately provide a buffer that helps protect cash investors during periods of volatility. In addition to debt repayments, these coffers also supplement particularly large cash outflows, making them an area of concern for cash investors. Here are some of the ways that money is spent, and the implications.
Figure 1: Cash, Cash Equivalents, and Marketable Securities as of 2021 (in millions)
Source: SEC, Bloomberg
Acquisitions
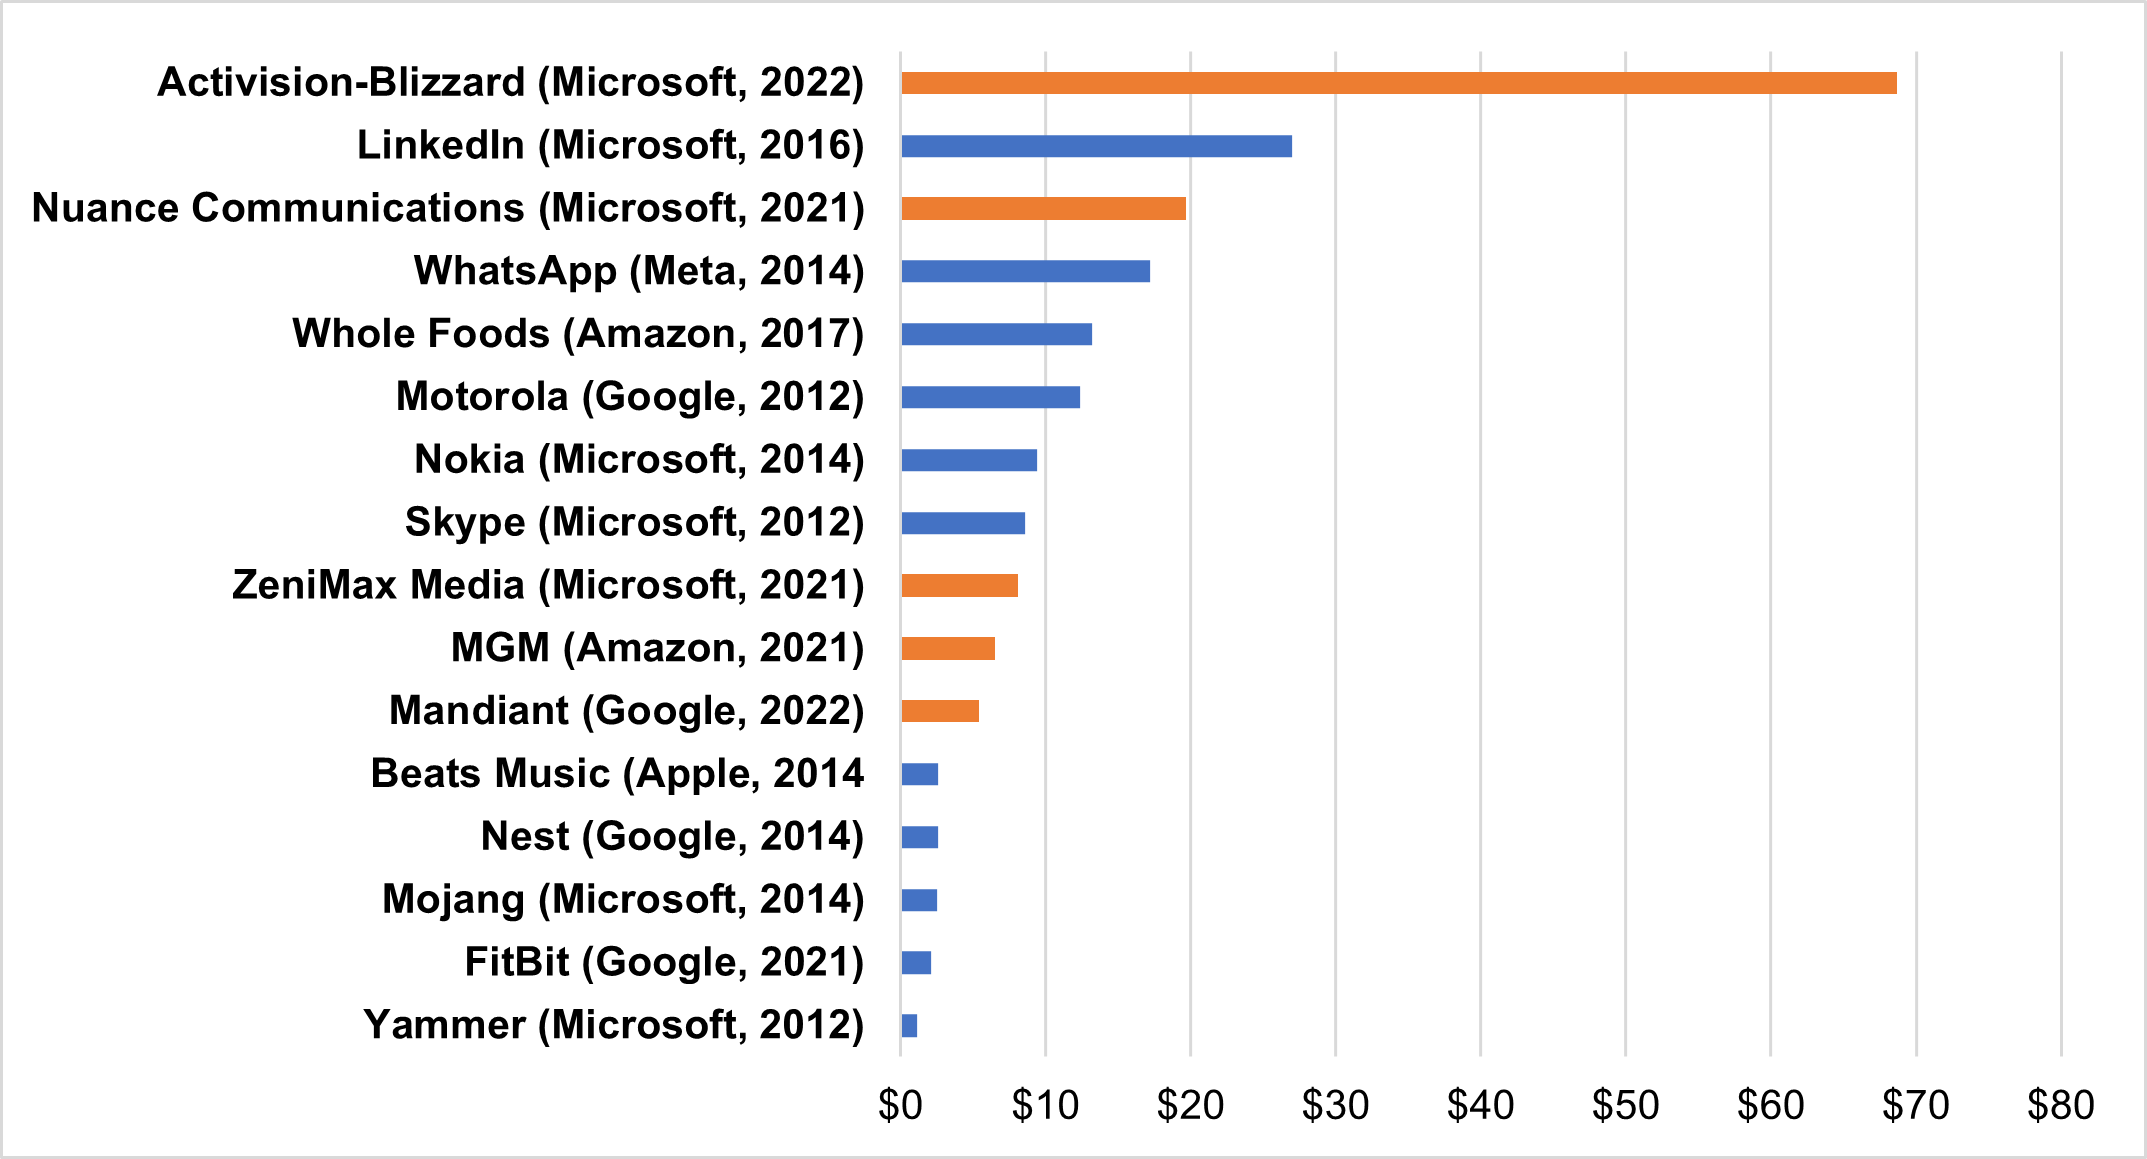
Perhaps the most significant use of cash by big tech firms is large-scale acquisitions of companies that bolster or expand their offerings. In the post-pandemic economic boom, Big Tech led the charge of global M&A volume, with some of Big Techs’ largest acquisitions coming in early 2022.
The most high-profile acquisition so far this year was Microsoft’s acquisition of video game publisher Activision-Blizzard for $68.7 billion in cash. Although the deal will deplete approximately half of their cash holdings, Microsoft will still be left with around $60 billion in cash and no material change in leverage, resulting in the company maintaining its triple-A rating.
Similarly, Google announced their second-largest acquisition ever in March of 2022, acquiring cybersecurity firm Mandiant for $5.4B to bolster Google Cloud’s security capabilities. Soon after, Amazon closed their second-largest acquisition ever, a $6.5 billion deal to acquire MGM adding to their film portfolio to Prime Video. Ultimately, the recent acquisitions have helped these firms bolster their current offerings while maintaining sufficient liquidity and debt levels despite their size, leaving them with both an operational and financial edge over their competitors.
Figure 2: Largest Big Tech Acquisitions 2012-2021 (Purchase price, net of cash acquired, in billions)
Source: SEC
Note: Fields in orange indicate acquisitions announced or closed in the last twelve months.
Other notable acquisitions in recent years have helped these firms enter new products and services. For example, Amazon’s $13.7 billion acquisition of Whole Foods marked their foray into grocery stores and physical stores2, while Google’s $2.1 billion FitBit acquisition3 allowed Google to better compete against the Apple Watch. As the tech landscape evolves, having the resources to enter these markets allows these firms to maintain their competitive advantage while also diversifying revenue streams.
Antitrust
The profitability of big tech firms and rapid growth of the technology sector has allowed these companies to expand their portfolio of products and services, but their influence has not gone unnoticed by global regulators. In recent years antitrust watchdogs have called for legislation aimed at curtailing their influence and have issued billion-dollar fines in reaction to anticompetitive business practices. We have previously covered some of these investigations and the US regulatory landscape in our blog Antitrust Anxiety: the Long Road to Big Tech Reform, and ultimately concluded that significant regulatory changes to these companies’ structures were years away, leaving cash investors with some breathing room.
In the near-term, they have incurred sizable fines, primarily in the EU, and this trend is likely to continue. Google in particular has racked up fines from the European Commission, totaling $9.5 billion across three different cases between 2017 and 2019.4 Meta was penalized $5 billion in 2019 by the FTC over user privacy, the largest privacy penalty by the FTC by a factor of 20. Additionally, Amazon was fined $1.3 billion last year by the Italian Competition Authority for giving preferential treatment to third-party sellers who used their logistics services. Despite the unprecedented legal penalties by government watchdogs, these fines only account for a small fraction of their cash holdings , consisting of 6.8% of Google’s year-end total and only 1.4% of Amazon’s.5,6 As a result, the fines have not had a material impact on their credit quality, with large cash holdings providing protection against a key industry risk.
Infrastructure
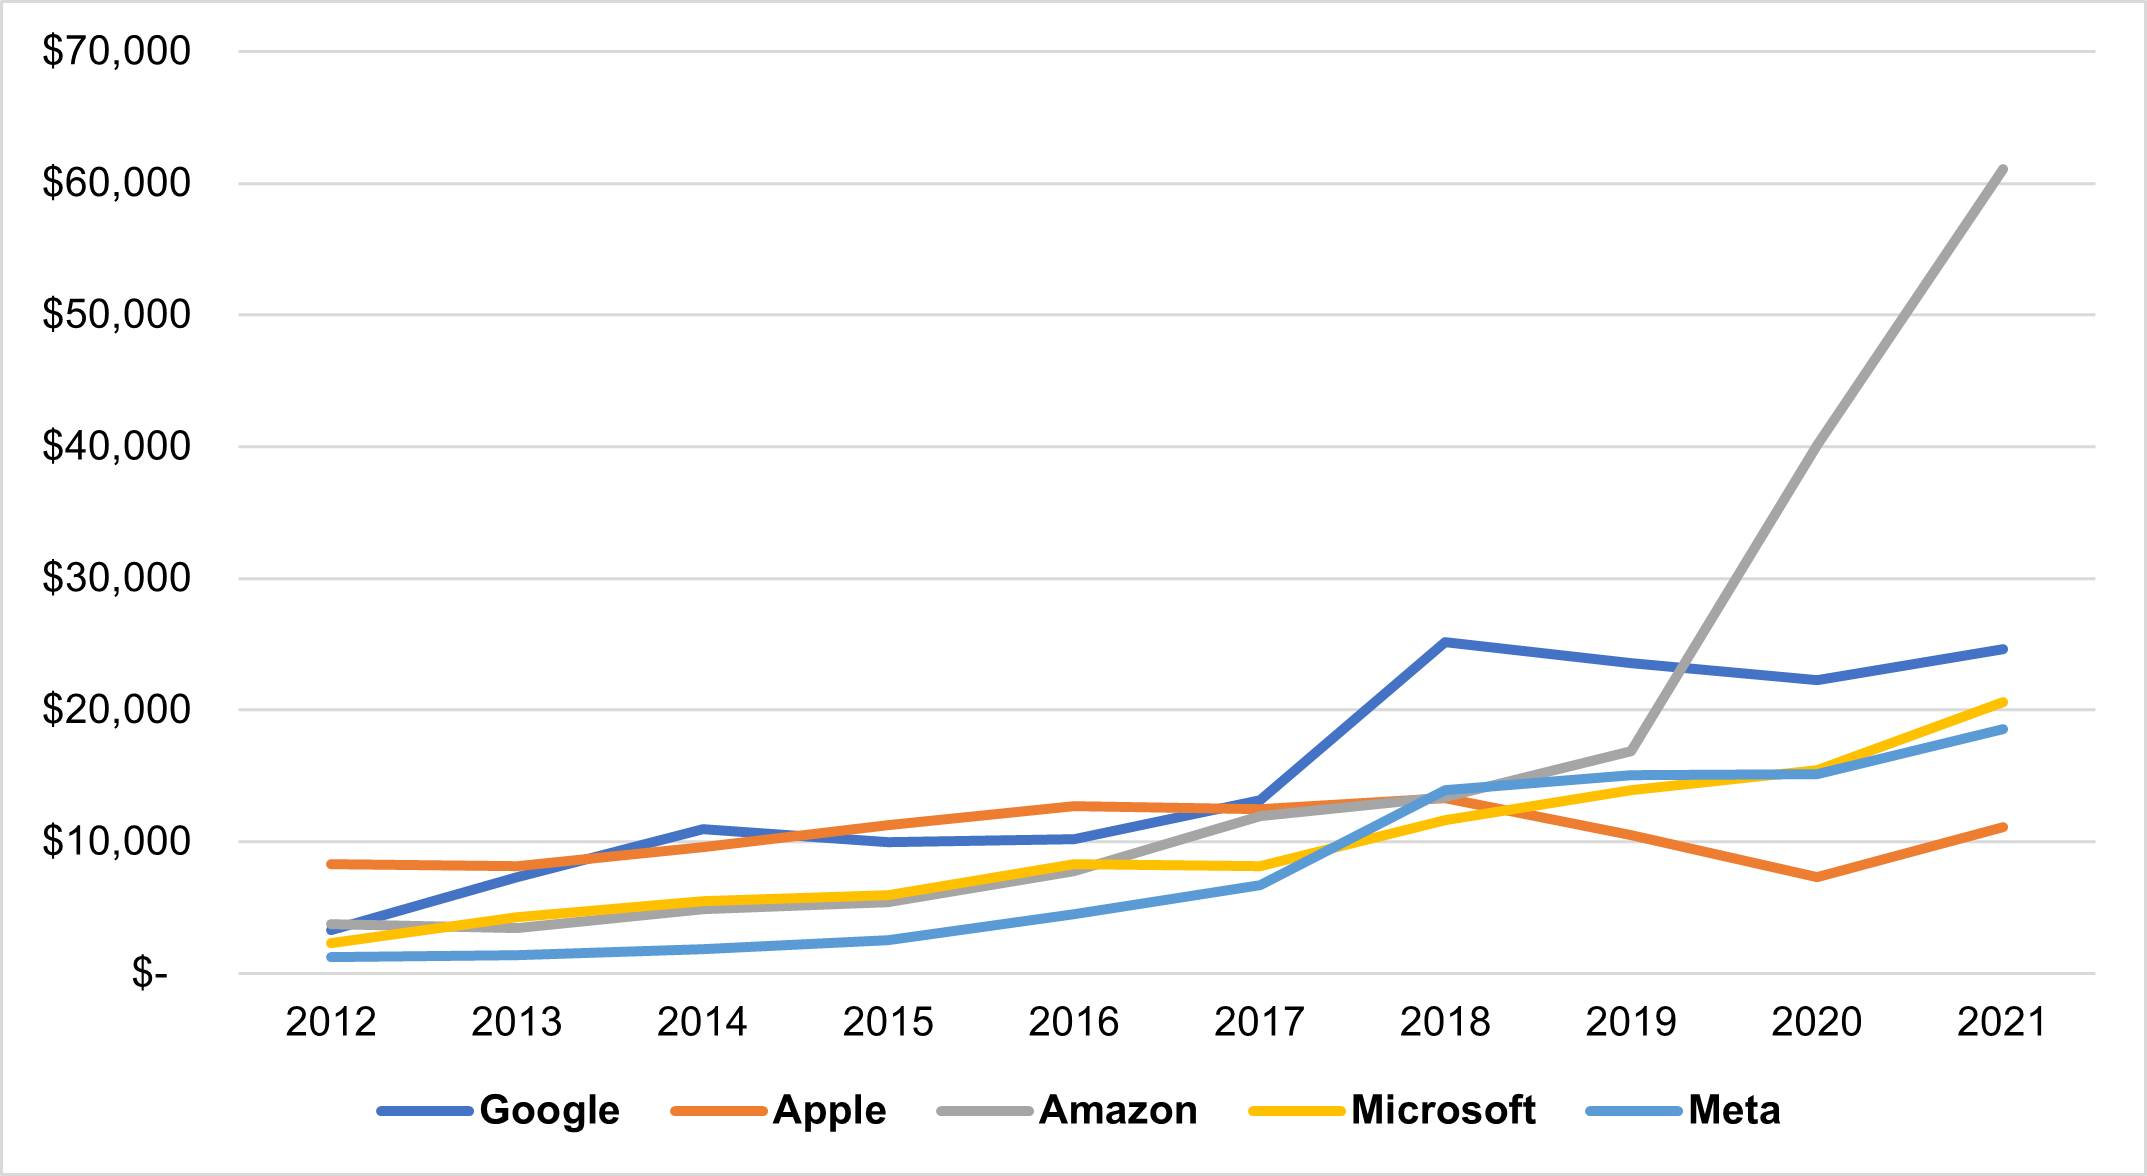
Recent industry trends have required big tech companies to increase investment in their infrastructure, for which cash on hand protects investors against pressure on free cash flow. The most prevalent trend is the shift towards cloud services, for which Google, Microsoft, and Amazon have ramped up investment for data centers and corporate offices to build their global networks. Other investments relate to delivery and manufacturing networks to meet demand. Amazon, for example, has spent heavily in the last two years to nearly double the size of their fulfillment network. Despite ballooning costs, Amazon’s cash holdings cover a significant portion of the company’s debt, supporting the rating. Across big tech, increases in capital expenditures have been offset by rising revenues. However, In the event of an economic downturn, these firms can rely on their cash holdings to help safeguard debtholders against possible revenue shortfalls.
Figure 3: Capital Expenditures (in $millions)
Source: SEC, Bloomberg
Where’s the Money?
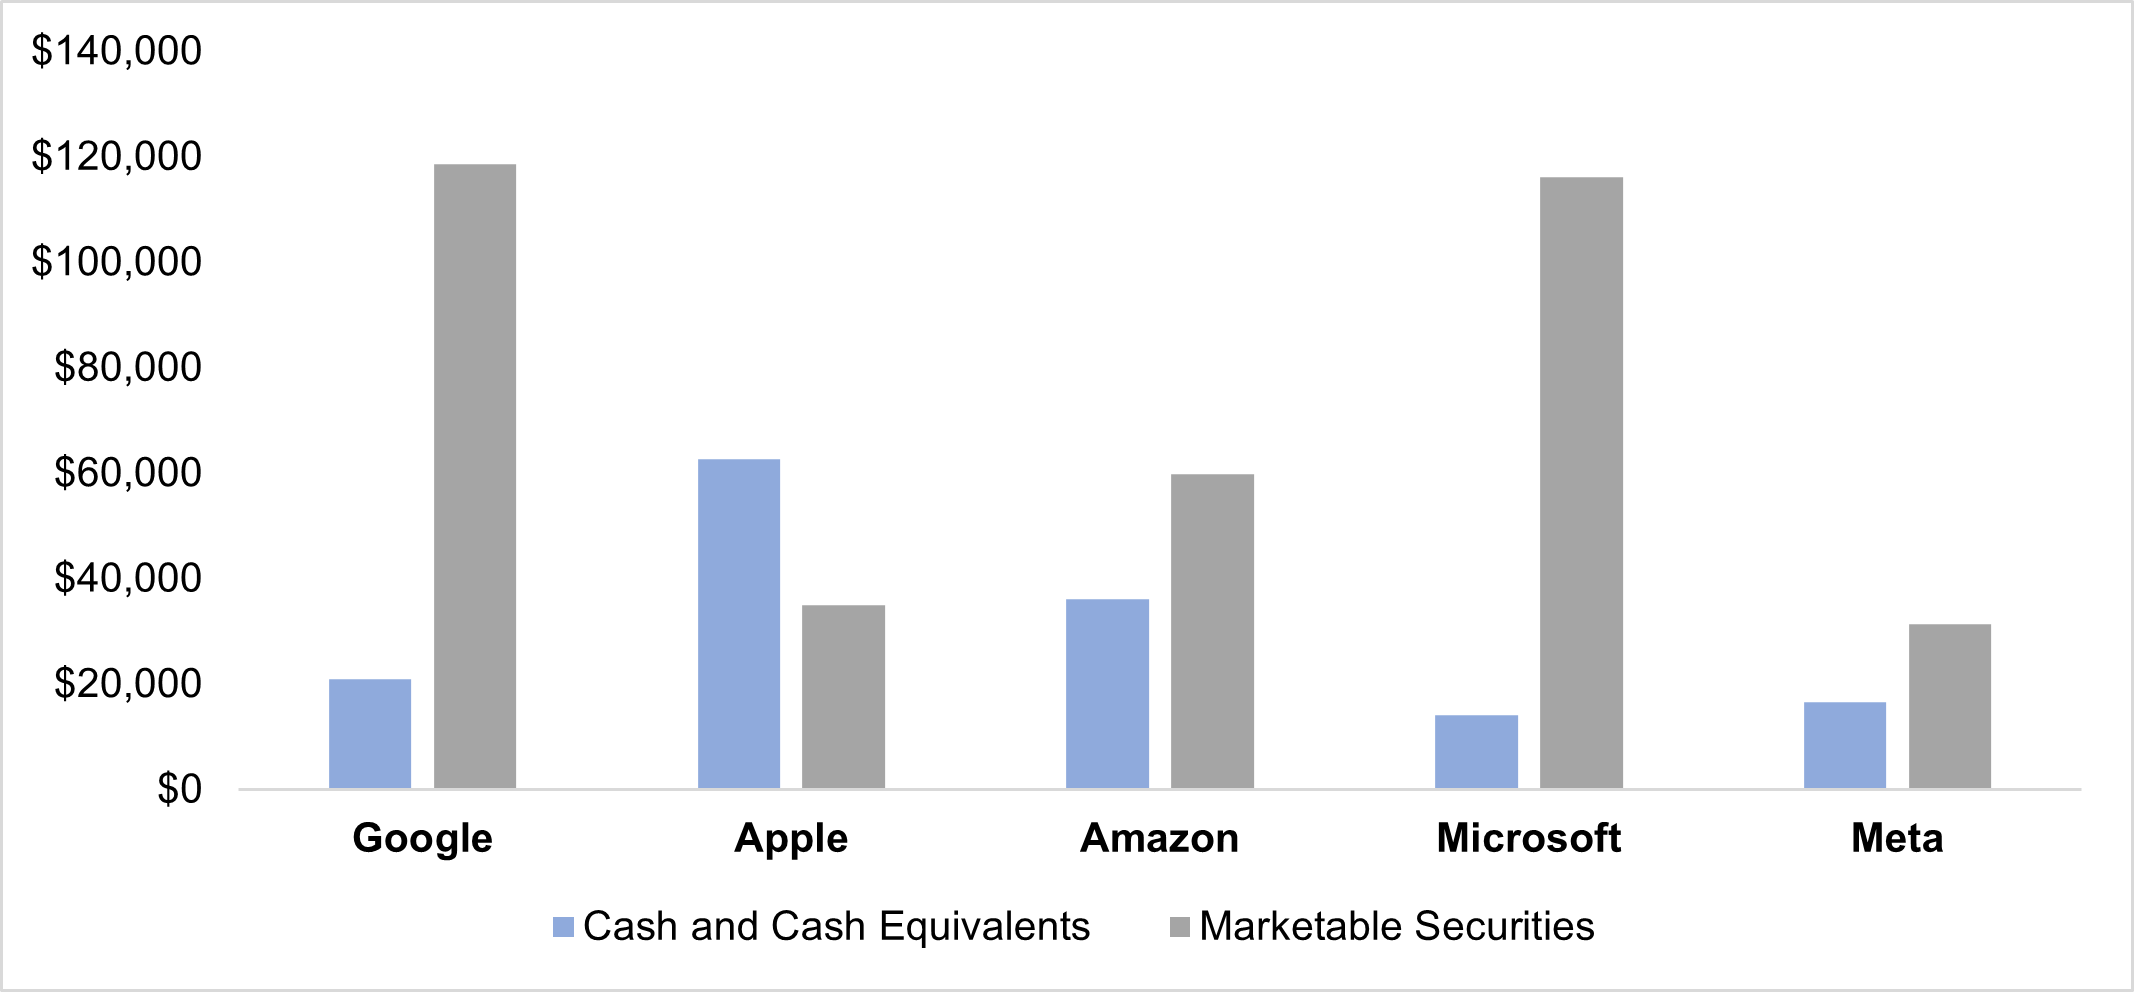
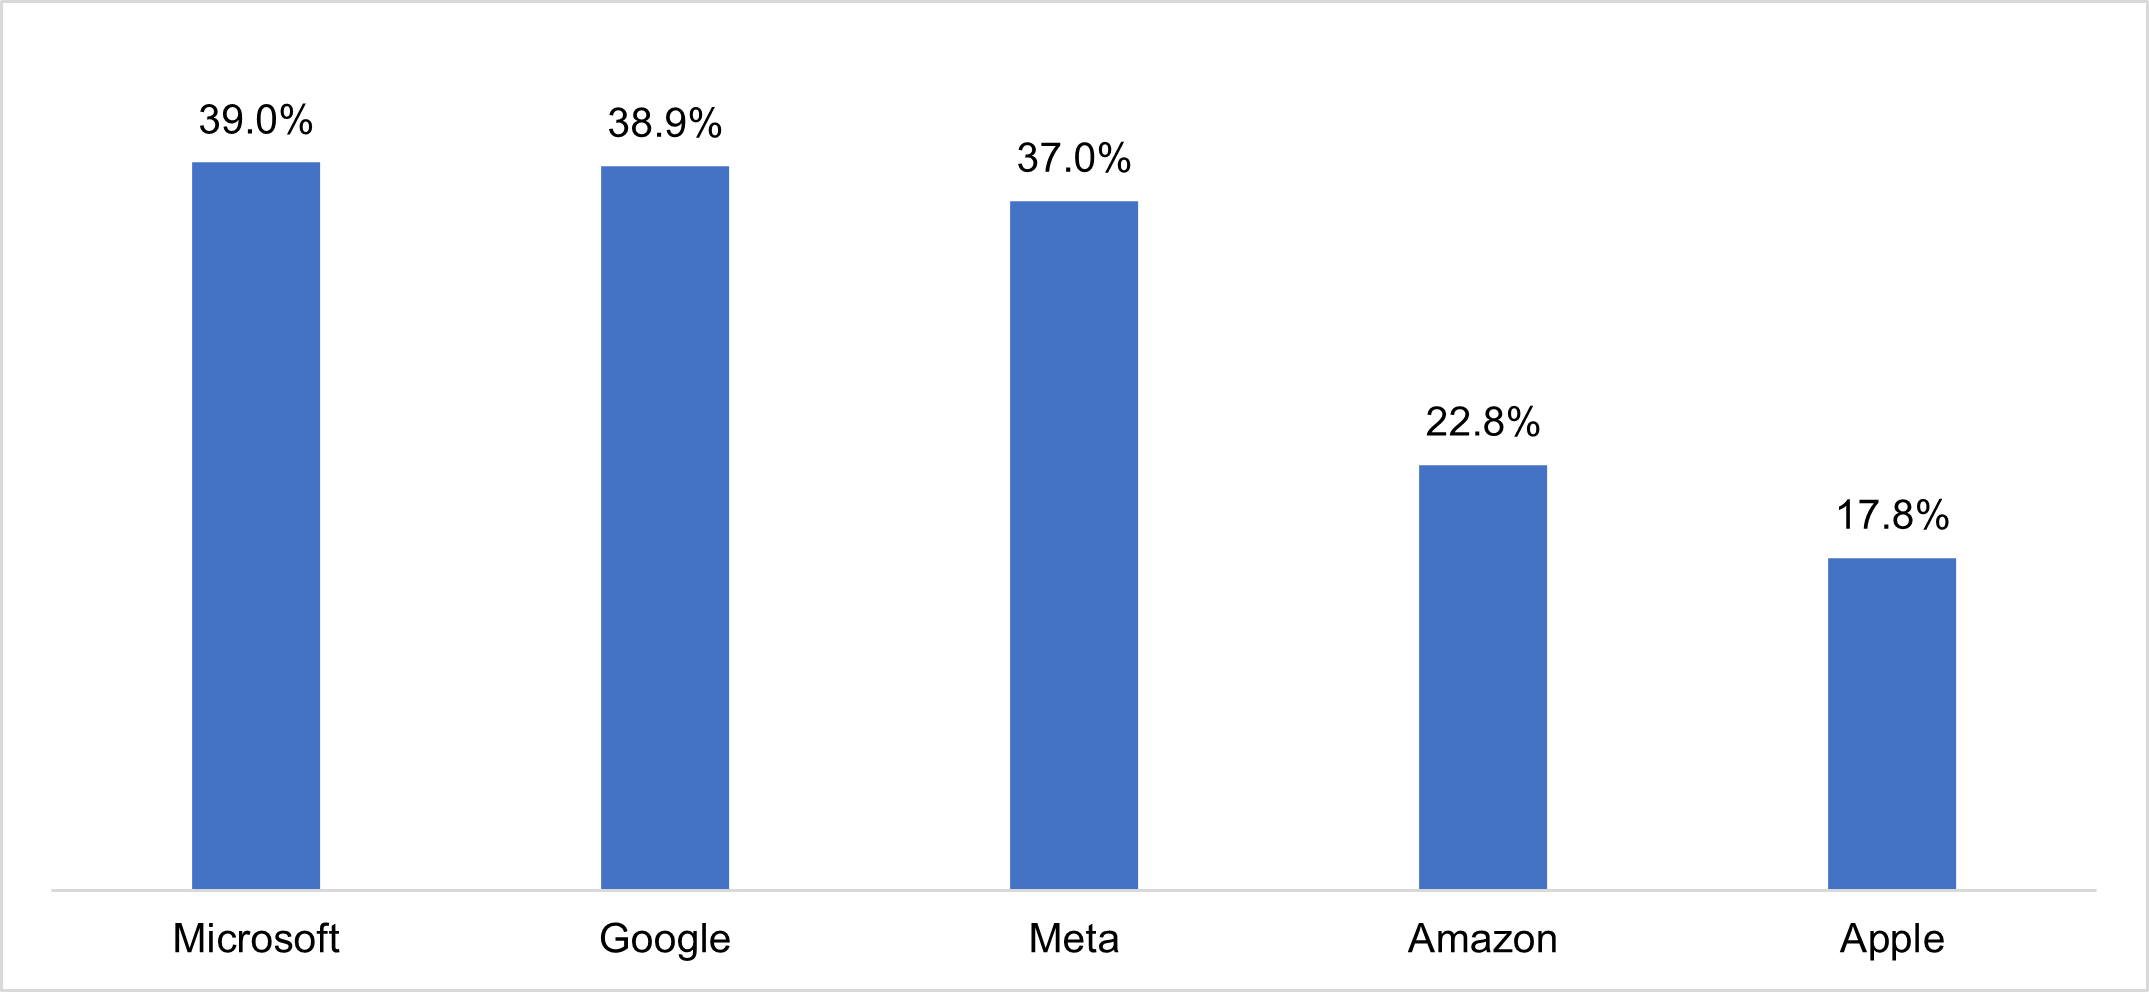
While large cash holdings are a common factor, the allocation of cash varies between firms. Across these firms, cash, cash equivalents, and marketable securities consist of around 20-40% of total assets as of 2021. Moreover, they also vary in terms of capital allocation. Google and Microsoft have parked most of their money in marketable securities, while Amazon, Apple, and Meta are more evenly split. They also differentiate in their concentration of short-term investments. According to company 10-Ks, their largest positions are generally in government securities, corporate debt instruments and money market funds, as well as mortgage- and asset-backed securities.7,8,9,10,11 Amazon is the exception due to their 18% ownership of Rivian Automotive, with an equity position valued at $15.6 billion. While more exposure to marketable securities could lead to greater volatility in security returns, these gains or losses are ultimately immaterial to the company’s credit rating given their sizes.
Figure 4: Cash Holdings as of Year-end 2021 (in $millions)
Source: SEC, Bloomberg
Figure 5: Cash, Cash Equivalents, and Marketable Securities as a % of Total Assets as of 2021
Source: SEC, Bloomberg
What Does This Mean for Investors?
In addition to handsome profits, the large balances of cash on hand reduce net debt and provide a hedge against market volatility. The large amounts of cash on hand provide big tech companies a vehicle to undertake substantial business costs, be it business combinations or infrastructure, while maintaining stable financial profiles. This has also helped diversify their revenue streams and reduce cyclicality, strengthening their credit profiles despite the reduction in cash balances. Moreover, should these companies see revenues drop, in a recession for example, they can dip into their savings to pay bondholders with plenty left over. Equity investors generally do not like companies holding large amounts of cash due to a desire for efficient capital allocation to enhance returns. For debt investors, however, they serve as an additional defense against downside risk.
2 https://www.nytimes.com/2017/06/16/business/dealbook/amazon-whole-foods.html
3 https://www.sec.gov/ix?doc=/Archives/edgar/data/0001652044/000165204422000019/goog-20211231.htm
4 https://www.sec.gov/ix?doc=/Archives/edgar/data/0001652044/000165204420000008/goog10-k2019.htm
5 https://www.sec.gov/ix?doc=/Archives/edgar/data/0001652044/000165204422000019/goog-20211231.htm
6 https://www.sec.gov/ix?doc=/Archives/edgar/data/0001018724/000101872422000005/amzn-20211231.htm
7 https://www.sec.gov/ix?doc=/Archives/edgar/data/0001652044/000165204422000019/goog-20211231.htm
8 https://www.sec.gov/ix?doc=/Archives/edgar/data/320193/000032019321000105/aapl-20210925.htm
9 https://www.sec.gov/ix?doc=/Archives/edgar/data/0001018724/000101872422000005/amzn-20211231.htm
10 https://www.sec.gov/ix?doc=/Archives/edgar/data/789019/000156459021039151/msft-10k_20210630.htm
11 https://www.sec.gov/ix?doc=/Archives/edgar/data/1326801/000132680122000018/fb-20211231.htm
Please click here for disclosure information: Our research is for personal, non-commercial use only. You may not copy, distribute or modify content contained on this Website without prior written authorization from Capital Advisors Group. By viewing this Website and/or downloading its content, you agree to the Terms of Use & Privacy Policy.
